
The Edit · Founder Insights
Waist-to-Height Ratio: What a Healthy Number Looks Like at Every Age
Waist-to-height ratio explained: how to measure it properly, why it screens cardiometabolic risk better than BMI, what the 0.5 rule means, and the bands that matter at every age.
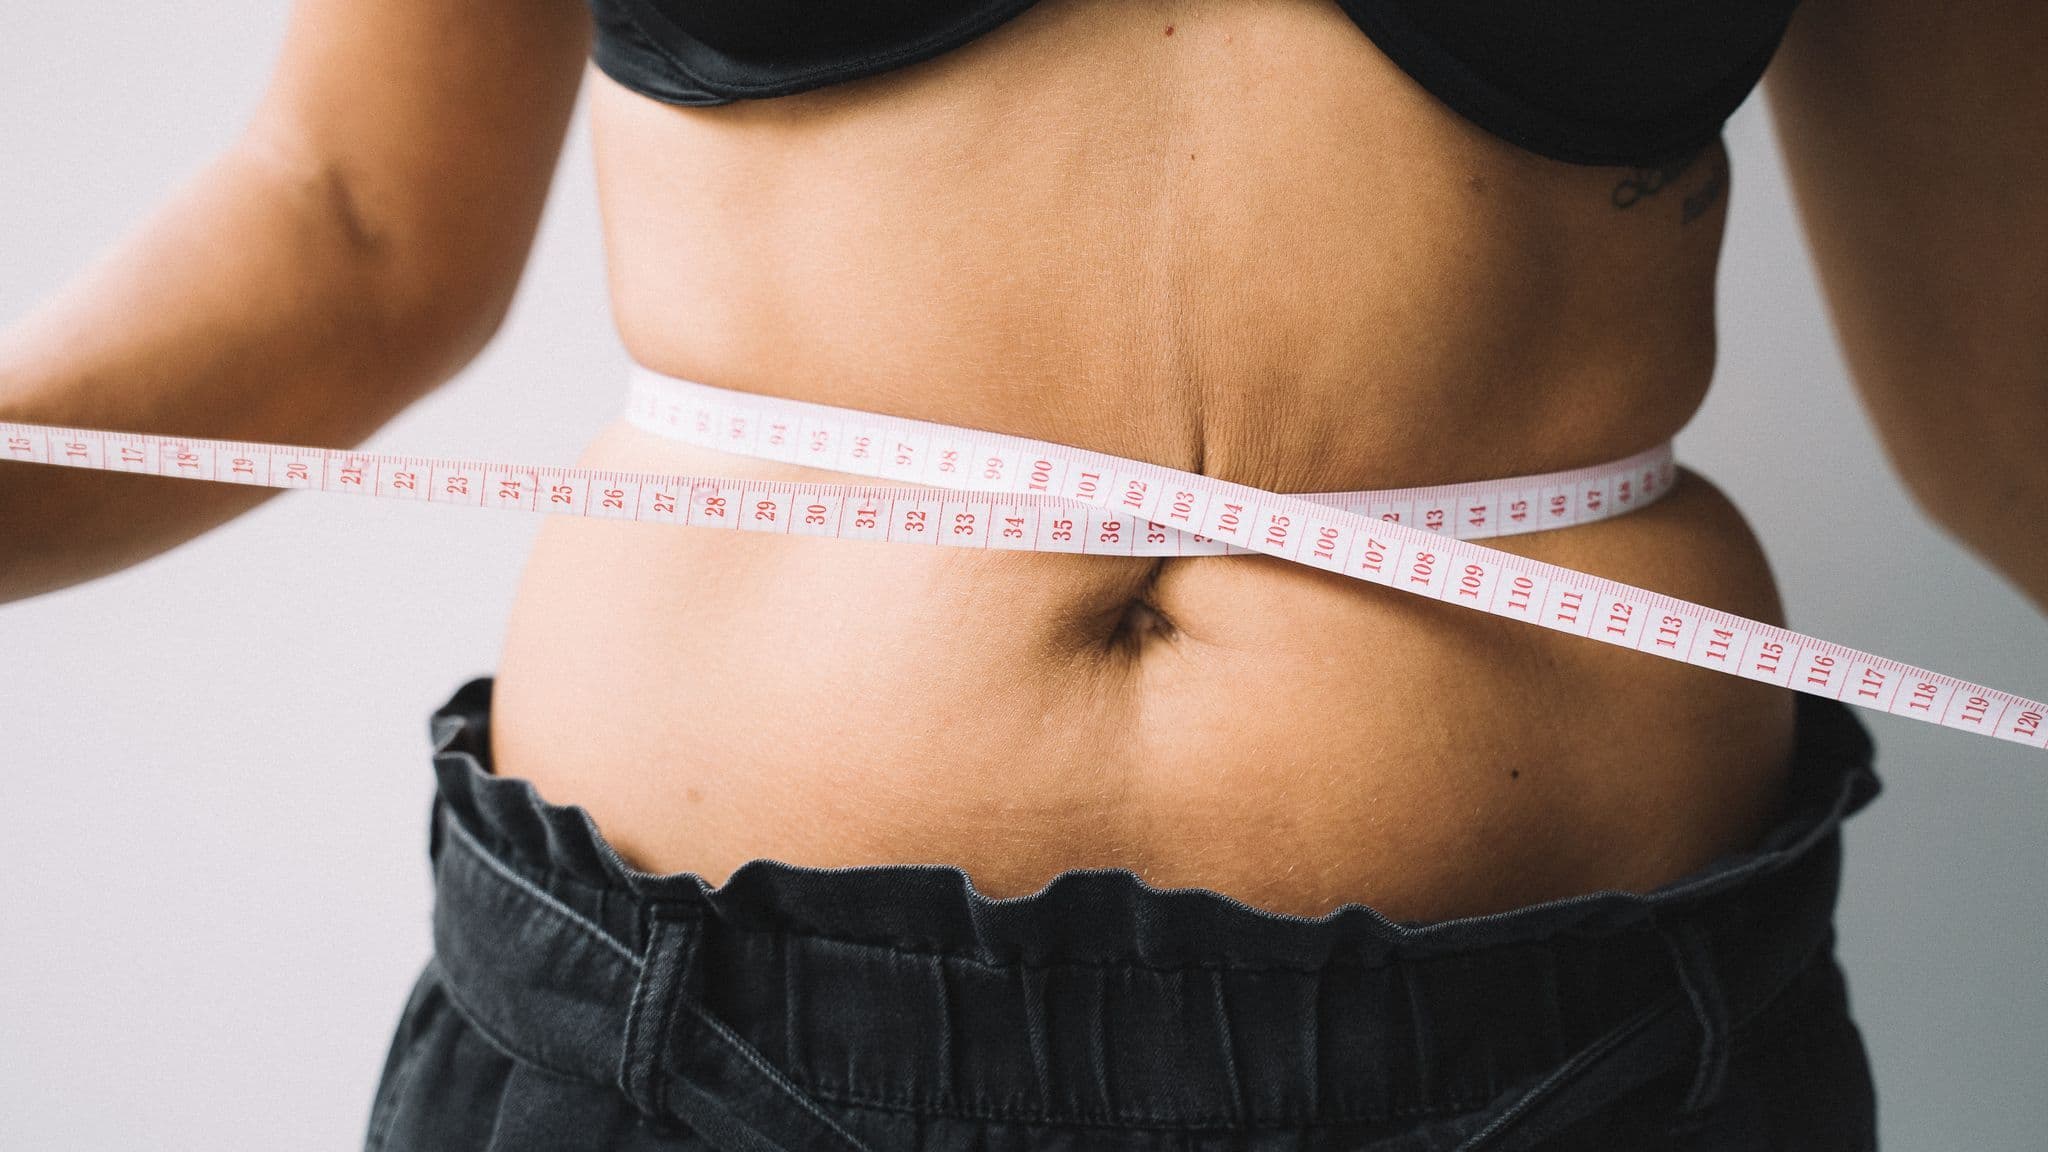
Waist-to-height ratio is the simplest serious health metric in existence: waist circumference divided by height, same units, one decimal answer, and one rule that survives every population it has been tested in, keep your waist below half your height. A ratio under 0.5 sits in the healthy zone at every adult age; 0.5 and above flags the abdominal fat that carries cardiometabolic risk, regardless of what your weight or BMI says. This guide covers how to measure it properly, the evidence that makes it a better screen than BMI, what the bands above and below 0.5 mean, and what actually moves the number, with our waist-to-height calculator doing the arithmetic for you.
| Ratio | Band | What it means | Sensible next step |
|---|---|---|---|
| Below 0.40 | Lean | Abdominal fat is low; check muscle is not low too | Confirm muscle mass with a body composition scan |
| 0.40 to 0.49 | Healthy | The zone the evidence keeps endorsing at every age | Maintain; re-measure quarterly |
| 0.50 to 0.59 | Increased risk | Visceral fat is accumulating; risk rises with the ratio | Train, adjust nutrition, re-measure in 12 weeks |
| 0.60 and above | High risk | Strong signal for cardiometabolic screening | See your doctor for a metabolic work-up alongside training |
TL;DR
- Waist divided by height, both in centimetres: under 0.5 is the healthy zone, and the boundary holds across sex, ethnicity and adult age.
- Meta-analysis across more than 300,000 adults found waist-to-height ratio a better screening tool than BMI or waist circumference alone for diabetes, hypertension and cardiovascular risk.
- BMI cannot see where weight sits; the ratio specifically captures the abdominal fat that does the metabolic damage, which matters doubly in Asian populations.
- Measure at the navel, relaxed, after a normal exhale, same time of day; the trend across months is the signal.
- The number responds to the unglamorous levers: strength training, aerobic base, protein-forward nutrition at a modest deficit, and sleep.
Health screening is drowning in metrics, and almost all of them need a machine, a clinic or a subscription. Waist-to-height ratio needs a tape measure and division, which is precisely why the research community has spent two decades checking whether something so cheap can really outperform the BMI printed on every screening report. The short answer, established across hundreds of thousands of adults, is yes, for the risks that matter most. The longer answer, including the boundary's fine print and what to do about your own number, is this article. For the fuller pairing with muscle mass, the other half of the body-composition story, our piece on the two numbers that beat your weight is the companion read.
1. How to measure it properly
The measurement takes thirty seconds and most people do it wrong in one of three ways: wrong place, wrong breath, or wrong tension.
The place: level with your navel, all the way around, with the tape parallel to the floor. Clinical protocols vary slightly, some use the midpoint between the lowest rib and the top of the hip bone, but the navel is the reproducible landmark for self-measurement, and reproducibility is what matters, because you are building a trend, not a lab result. The breath: measure at the end of a normal, relaxed exhale, not sucked in, not pushed out. The tension: the tape sits snug against the skin without compressing it; if it dents you, it is lying to you.
Then the arithmetic: waist in centimetres divided by height in centimetres. A 90cm waist on a 175cm frame is 0.51; an 80cm waist on the same frame is 0.46. Our calculator handles the division and places the answer on the bands from this article.
Standardise the conditions the way you would a weigh-in: morning, before food, same tape, monthly or quarterly rather than daily, because abdominal measurements wobble a centimetre or two with meals, fluid and hormones, and daily measuring turns signal into anxiety. Write it down each time; the four-measurement trend across a year says more than any single reading ever can.
2. Why it beats BMI
BMI's failure is structural: weight divided by height squared cannot see where the weight sits, and location is most of the story. Fat stored around the organs, the visceral depot, drives insulin resistance, blood pressure and lipid dysfunction in ways subcutaneous fat on the hips and thighs does not; our review of what visceral fat predicts covers the mechanism. Two people at identical BMI can carry opposite metabolic prospects, the muscular one misclassified as overweight, the thin-outside-fat-inside one waved through screening. Waist-to-height ratio fixes the blindness by measuring exactly where the risk lives, and scaling it to frame size.
The comparative evidence is unusually clean. The 2012 systematic review and meta-analysis in Obesity Reviews, pooling studies covering more than 300,000 adults across multiple ethnic groups, concluded that waist-to-height ratio was a better screening tool than both waist circumference alone and BMI for adult cardiometabolic risk factors, diabetes, hypertension, dyslipidaemia and cardiovascular outcomes, in both sexes. That is not a subtle statistical edge buried in a subgroup; it is the headline finding of the largest comparison of the cheap anthropometric screens.
None of this makes BMI useless; at population scale it remains a workable coarse filter, and at the extremes it agrees with every other metric. But for an individual adult standing in a Singapore screening queue, the ratio answers the question BMI cannot: is the weight in the place that does the damage? A tape measure, embarrassingly, out-screens the formula on every health report you have ever received.
3. The 0.5 rule
The boundary value of 0.5, the rule remembered as keep your waist to less than half your height, was not chosen for its slogan value, though the slogan has done wonders for it. The 2010 systematic review in Nutrition Research Reviews examined the proposed boundary across studies from fourteen countries and found 0.5 to be a sensible global screening threshold for the prediction of diabetes and cardiovascular disease, holding usefully steady across sexes, adult age groups and ethnicities.
That population-robustness is the ratio's quiet superpower, and it is worth pausing on why it works. Taller people get proportionally more waist allowance; men and women, despite different fat distributions, cross into risk at approximately the same ratio; and the ethnicity adjustments that plague BMI, of which more in chapter six, largely self-correct because the ratio indexes the risky depot directly. One number, one threshold, no lookup tables: there is nothing else in health screening this portable.
Treat the boundary the way the evidence does: as the centre of a gradient, not a cliff. Risk does not switch on at 0.500 and off at 0.499; it climbs continuously as the ratio rises, which means 0.52 is a nudge, not a diagnosis, and 0.62 is a louder message than 0.52. The bands in the next chapter put working labels on that gradient, and the trend in your own measurements, crossing 0.5 from above, drifting toward it from below, carries more personal information than the boundary itself.
4. The bands above and below
The working bands used in screening practice, and in our calculator, read as follows.
Below 0.40, the lean zone: abdominal fat is genuinely low. The one caution here is that a very low ratio certifies the absence of central fat, not the presence of health; pair it with a muscle check, because a low ratio over low muscle is its own ageing risk, the pattern our SMI and waist-to-height article flags, and an InBody scan read properly settles it in a minute.
0.40 to 0.49, the healthy zone: the range the outcome studies keep endorsing. The job here is boring maintenance and a quarterly tape habit.
0.50 to 0.59, increased risk: visceral accumulation is underway, and this band is where the ratio earns its keep, because it typically lights up years before fasting glucose or blood pressure do, while the fix is still entirely behavioural. Twelve weeks of the levers in chapter seven reliably moves a number in this band; treat it as the cheapest early warning you will ever receive.
0.60 and above, high risk: the association studies put this band at substantially elevated odds for diabetes, hypertension and cardiovascular disease, and the sensible response pairs training with a proper medical look, fasting metabolic panel, blood pressure, lipids, through your GP or a screening package. The ratio is a screen, not a diagnosis; above 0.6 it is a screen that has done its job and is pointing firmly at a doctor's door. Our guide to the five numbers that matter in an annual screening shows where it slots into that conversation.
5. Does age change the target?
The honest, slightly unfashionable answer: not meaningfully. Unlike body fat percentage, where healthy ranges genuinely drift upward with age, per our age-by-age guide, the 0.5 boundary was validated across adult age groups and holds as the screening line for a 68-year-old as it does for a 28-year-old. Some researchers have proposed a more lenient shoulder, toward the mid-0.5s, for older adults, and a stricter eye, toward 0.45, for younger ones, but the meta-analytic position remains that half your height is the line worth knowing at every age.
What does change with age is the difficulty of holding the line, and the stakes of failing to. Waist circumference creeps with the decades for well-understood reasons: muscle mass declines from midlife, which lowers resting energy use; hormonal shifts, menopause in particular, redistribute fat toward the abdomen; and activity quietly falls. A 50-year-old holding the same ratio as their 35-year-old self is not standing still; they are actively out-rowing a current. The recomposition-after-40 playbook exists precisely because that current is beatable.
The stakes side is equally asymmetric: the cardiometabolic conditions the ratio screens for compound with age, so a 0.57 at 60 carries more absolute risk than the same number at 30, even though the band label reads identically. Practical translation: the young get no licence from a good number, and the older get no despair from a rising one, since the levers in chapter seven work at every age, with the muscle-first version mattering more each decade.
6. Why it matters more in Asian bodies
Singapore's screening context gives the ratio an extra job. It is well established that Asian populations develop diabetes and cardiovascular disease at lower BMIs than European populations, in large part because of a tendency to store proportionally more fat viscerally at any given weight, the thin-outside, metabolically-loaded pattern that BMI is structurally blind to. Health authorities have historically patched this with lowered Asian BMI cut-offs, an admission, in table form, that the underlying metric measures the wrong thing.
Waist-to-height ratio needs no such patch, because it measures the depot that drives the ethnic difference directly: the same 0.5 line applies, and the meta-analytic evidence behind it included Asian cohorts. For a Singaporean audience this has a blunt practical meaning: a normal BMI on your screening report is weaker reassurance here than almost anywhere, and the thirty-second tape measurement is the corrective. We see the pattern weekly on the assessment floor, professionals with unremarkable BMIs, elevated ratios, and visceral fat levels to match, discovering that the scale had been changing the subject for years.
The corollary runs in the other direction too. The lowered Asian BMI cut-offs over-flag muscular adults just as the standard ones do, and a trained 172cm man at 78kg can wear an overweight label while carrying a 0.44 ratio and excellent metabolic numbers. The ratio adjudicates both errors with the same tape. If your family history includes type 2 diabetes, as it does for a large share of Singaporeans, the quarterly measurement habit is arguably the highest-value ritual in this article.
7. What actually moves the number
The encouraging physiology: visceral fat, the depot the ratio tracks, is the most metabolically active fat you carry, and it responds to intervention faster than the subcutaneous fat you can pinch. People who begin genuine training and nutrition changes routinely watch the tape move within eight to twelve weeks, ahead of any dramatic scale change, which is exactly why we re-measure at the 16-week Checkpoint rather than weekly.
The levers, in order of leverage. A modest, sustained calorie deficit does the heavy lifting; the crash versions backfire by burning muscle along with fat, the trade our muscle-loss-while-dieting piece quantifies, and the sustainable architecture is laid out in the evidence-based fat loss guide. Strength training two to three times weekly protects that muscle while the deficit runs and raises the resting energy budget the waistline answers to; the three-hours-a-week dose is enough. Aerobic base work, the Zone 2 kind, has repeatedly shown particular purchase on the visceral depot. And the unglamorous pair, seven hours of sleep and drinking that stays moderate, both act directly on abdominal storage through cortisol and straightforward calories respectively.
What does not move it: waist trainers, which relocate nothing, spot-reduction abdominal work, which the abs evidence is blunt about, and detox products of every description. The tape responds to energy balance, training and time, measured quarterly, exactly the loop a coached block is built to run.
Your thirty-second next step
Measure it now, honestly, navel, relaxed exhale, snug tape, and run the division or let the calculator do it. Under 0.5: maintain, re-measure quarterly, and confirm the muscle half of the story with a scan. Between 0.5 and 0.6: start the twelve-week loop from chapter seven this month, while the fix is still entirely in your hands. At 0.6 or above: book the GP conversation alongside the training, not instead of it. One tape measure, one rule, one quarterly appointment with honesty; screening does not get cheaper than this.
Frequently asked questions
Q. What is a good waist-to-height ratio?
Below 0.5, waist less than half your height, at every adult age and for both sexes. The 0.40 to 0.49 band is the healthy zone the outcome studies endorse; 0.5 to 0.59 signals increased cardiometabolic risk, and 0.6 or above warrants a medical work-up alongside lifestyle change.
Q. Is waist-to-height ratio better than BMI?
For screening cardiometabolic risk, yes: meta-analysis across more than 300,000 adults found it outperformed both BMI and waist circumference alone for diabetes, hypertension and cardiovascular risk factors, because it captures the abdominal fat BMI cannot see.
Q. Where exactly do I measure my waist?
Level with the navel, tape parallel to the floor, snug without compressing, at the end of a relaxed exhale. Measure in the morning under the same conditions each time, monthly or quarterly, and track the trend rather than reacting to single readings.
Q. Does the 0.5 rule apply to Asians?
Yes, and it is arguably more useful here: Asian populations carry more visceral fat at any given BMI, which is why BMI needs lowered Asian cut-offs while the 0.5 ratio boundary applies unchanged. The validation evidence behind the threshold includes Asian cohorts.
Q. How fast can I improve my waist-to-height ratio?
Visceral fat responds faster than any other depot: with a modest calorie deficit, strength training and aerobic base work, meaningful tape movement typically shows within eight to twelve weeks. Re-measure quarterly and let the trend judge the programme.
Half your height. It is difficult to think of another health rule that fits in three words, costs nothing to check, and stands on evidence from fourteen countries and three hundred thousand adults. Measure it this week, file the number, and let the quarterly trend tell you whether the current programme is defending the only waistline you get. The companion reads: what visceral fat predicts and the two numbers that beat your weight.
The waist-to-height ratio is one of the four pillars we measure on every client, alongside muscle mass, strength and aerobic capacity, in the Catalyst 4-Pillar Healthspan Assessment at our Raffles Place studio. If your tape measurement this week said something you did not expect, book a complimentary consultation and we will put the number in its full context.
Citations
- Ashwell M, Gunn P, Gibson S. Waist-to-height ratio is a better screening tool than waist circumference and BMI for adult cardiometabolic risk factors: systematic review and meta-analysis. Obesity Reviews. 2012;13(3):275-286. doi:10.1111/j.1467-789X.2011.00952.x
- Browning LM, Hsieh SD, Ashwell M. A systematic review of waist-to-height ratio as a screening tool for the prediction of cardiovascular disease and diabetes: 0.5 could be a suitable global boundary value. Nutrition Research Reviews. 2010;23(2):247-269. doi:10.1017/S0954422410000144