Skip to content
Catalyst Performance

Singapore vs the World · Reviewed monthly

Fitness and longevity statistics, Singapore and the world

In 2024, 84.7% of Singapore adults met physical activity guidelines, but only 24.7% of that activity was leisure-time exercise. People in Singapore spend roughly 10 to 12 years of life in less than full health. Among Singaporeans aged 60 and above, 32.2% meet the diagnostic criteria for sarcopenia. Worldwide, 31.3% of adults do not get enough physical activity.

A primary-sourced reference on physical activity, healthspan, and strength, with every figure compared between Singapore and the wider world. Built to be cited. Reviewed and refreshed every month.

Last updated

The picture

Two flows behind the headline numbers

Just over half of the activity that counts towards the guidelines is commuting, and men and women live roughly 10 to 12 years in less than full health. Each flow uses one source, so its parts add up to its whole.

Where the activity comes from

Share of total weekly physical activity by where it happens, Singapore, 2024.

All activity

Commuting

51.6%

Leisure exercise

24.7%

Work

23.6%

Show as a table
FromToValue
All activityCommuting51.6%
All activityLeisure exercise24.7%
All activityWork23.6%
Source: Ministry of Health Singapore and Health Promotion Board, National Population Health Survey 2024

Where the years go

Years of life at birth, in good health and in less than full health, Singapore, 2023.

Men

83.1 years

Women

87.5 years

Healthy years

72.8 years men, 75.4 years women

Less than full health

10.3 years men, 12.1 years women

Show as a table
FromToValue
MenHealthy years72.8 years
MenLess than full health10.3 years
WomenHealthy years75.4 years
WomenLess than full health12.1 years
Source: Ministry of Health Singapore, Population and Vital Statistics

Key findings

The five numbers that matter most

  • 01

    84.7% of Singapore adults met physical activity guidelines in 2024, but only 24.7% of that activity was leisure-time exercise. The rest is mostly commuting. See source →

  • 02

    People in Singapore spend roughly 10 years (men, 10.3) to 12 years (women, 12.1) of life in less than full health, measured on one method, the Global Burden of Disease 2023 as published by the Ministry of Health. See source →

  • 03

    The mortality benefit of strength training peaks at around 60 minutes a week, where all-cause mortality risk is 27% lower, and higher training volumes do not add to it. See source →

  • 04

    About 35.7% of Singapore residents aged 18 to 74 do muscle-strengthening exercise at least twice a week, against 17.3% of European adults, and the Singapore rate drops from 45.2% at ages 18 to 29 to between 31% and 36% in every older age group. See source →

  • 05

    32.2% of Singaporeans aged 60 and above meet the diagnostic criteria for sarcopenia, the age-related loss of muscle. See source →

At a glance

Every statistic on one table

Writing about these numbers? Four of them are available as charts you can embed, free, with attribution.

How much the world moves, and how much it does not.

Physical activity and inactivity

Stat 01

Nearly a third of adults worldwide do not get enough physical activity.

Verified 2 October 2026

Global

31.3%

of adults insufficiently active (2022)

Source: World Health Organization and The Lancet Global Health, 2024 →

ComparedInactivity has risen for two decades, from 23.4% in 2000, and is projected to reach 34.7% by 2030 on the current trend.
Stat 02

High-income Asia Pacific is the least physically active region in the world.

Verified 2 October 2026

Global

48.1%

of adults in the region insufficiently active

Source: World Health Organization and The Lancet Global Health, 2024 →

ComparedSingapore sits inside this region. Its regional inactivity rate is the highest of any region measured, well above the 31% global average.

Stat 03

Most Singapore residents meet total activity guidelines, but largely through commuting rather than exercise.

Verified 2 October 2026

Singapore

84.7%

had sufficient total physical activity (2024), up from 78.5% in 2023

Source: Ministry of Health Singapore and Health Promotion Board, 2024

ComparedCommuting made up 51.6% of that activity and leisure-time exercise just 24.7%. The headline figure is healthy; the deliberate-training share is far smaller.

Stat 04

Obesity among Singapore adults has reached its highest recorded level, even as total activity figures look healthy on paper.

Verified 2 October 2026

Singapore

12.7%

of adults classified as obese in 2024, up from 10.5% in 2022

Source: Ministry of Health Singapore and Health Promotion Board, 2024

ComparedThe same NPHS 2024 survey that found 84.7% of residents meeting total activity guidelines also recorded a record obesity rate. Total minutes of movement is not the same as metabolically effective exercise.

Stat 05

More than two in five Singapore adults carry excess fat around the waist, and it rises sharply with age.

Verified 2 October 2026

Singapore

43.6%

of residents aged 18 to 74 had abdominal obesity in 2023 to 2024 (waist over 90 cm for men, over 80 cm for women); 54.2% at ages 60 to 74

Source: Ministry of Health Singapore and Health Promotion Board, 2024

ComparedWaist measurement catches what the scale and BMI can miss. It was measured in the survey's health examinations, so it is a reading, not self-report, and the rate climbs past one in two among residents aged 60 to 74.

Stat 06

About three in four Singapore residents take part in sport or exercise at least once a week.

Verified 2 October 2026

Singapore

72% to 76%

regular participation in sport or exercise, at least once a week (2024): women 72%, men 76%

Source: Sport Singapore, 2024

ComparedOnce a week is the survey's threshold, not a training dose. Read alongside the National Population Health Survey, where leisure-time exercise made up just 24.7% of total physical activity, it says participation is broad and shallow. Frequency, not willingness, is the gap.

Stat 07

The mortality benefit of daily steps levels off well below the 10,000-step target most people are aiming at.

Verified 2 October 2026

Global

6,000 to 8,000

steps per day, the point at which mortality risk stops falling for adults aged 60 and above; 8,000 to 10,000 for adults under 60

Source: The Lancet Public Health, 2022 →

ComparedWalking works, and it works early. Adults in the second-lowest quartile of daily steps already had 40% lower mortality than the lowest, a difference of roughly 2,200 steps. What the curve also shows is a ceiling. Once the step count is met, more steps stop being the lever, and deliberate strength and fitness work has to take over.

How long we live, and how much of it is spent in good health.

Lifespan and healthspan

Stat 08

Singapore has one of the longest life expectancies in the world.

Verified 2 October 2026

Singapore

83.9 years

life expectancy at birth (2025)

Source: Department of Statistics Singapore, 2026

Global

71.4 years

global life expectancy at birth (2021)

Source: World Health Organization, 2024

ComparedA Singapore resident outlives the global average by more than 12 years.

Stat 09

A Singapore resident who reaches 65 can expect about another 21.6 years, and women get 3.2 years more than men.

Verified 2 October 2026

Singapore

21.6 years

additional years of life at age 65 in 2025: 19.9 years for men (to age 84.9) and 23.1 years for women (to age 88.1)

Source: Department of Statistics Singapore, 2026

ComparedUp 0.8 years from 2015. The years after 65 are where muscle, balance and aerobic fitness shape how independent that time is, which is why they sit at the centre of this page. The Department of Statistics notes that life expectancies for 2020 to 2023 were affected by COVID-19 mortality.

Stat 10

Almost two in three newborn girls and nearly one in two newborn boys in Singapore are expected to live to 85.

Verified 2 October 2026

Singapore

64.3%

of newborn girls are expected to be alive at age 85 under the 2025 life table (59.0% in 2015); for newborn boys it is 47.6% (42.3% in 2015)

Source: Department of Statistics Singapore, 2026

ComparedReaching 85 is now the central case rather than the exception, so the question shifts from how long to how well. Survival at 65 is already 90.3% for boys and 94.4% for girls.

Stat 11

Nearly 1 in 5 Singapore residents is now aged 65 or older, up from about 1 in 8 a decade ago.

Verified 2 October 2026

Singapore

19.5%

of Singapore residents aged 65 and above in 2026, up from 12.4% in 2016

Source: Department of Statistics Singapore, 2026

ComparedThe share has risen by 7.1 percentage points in ten years. The cohort in which sarcopenia and cardiovascular risk compound is growing faster than the services designed to address it.

Stat 12

People in Singapore spend roughly 10 to 12 years of life in less than full health, and women spend nearly two years more than men.

Verified 2 October 2026

Singapore

10 to 12 years

lived in less than full health in 2023: 10.3 years for men (life expectancy 83.1, healthy life expectancy 72.8) and 12.1 years for women (87.5 and 75.4)

Source: Ministry of Health Singapore, 2026

ComparedBoth figures come from one method, the Global Burden of Disease 2023, so the subtraction is fair. The Department of Statistics figure of 83.9 years above counts residents only and uses a different method, so it should not be set against them. The global gap in 2023 was 10.7 years (below).

Stat 13

The gap between how long people live and how long they stay healthy has widened in almost every country.

Verified 2 October 2026

Global

10.7 years

global gap between life expectancy and healthy life expectancy in 2023, up from 8.8 years in 1990, an increase of 1.9 years or 21.9%; 14.5% of life was spent in poor health

Source: The Lancet Public Health, 2026 →

ComparedPoint estimates show the gap widening in 203 of 204 countries and territories, because survival improved faster than health. Musculoskeletal disorders (especially low back pain), mental disorders (depressive and anxiety disorders), sense organ diseases (age-related hearing loss) and unintentional injuries (falls), with other non-communicable diseases, account for 57.4% of unhealthy years.

Stat 14

Singapore is the first place to be designated a deliberately engineered longevity zone.

Verified 2 October 2026

Singapore

Blue Zone 2.0

designated by Dan Buettner

Source: Blue Zones, Dan Buettner, 2024

ComparedUnlike the five original Blue Zones, where longevity is traditional, Singapore's was built through policy. Life expectancy has risen about 20 years since 1960.

Why muscle and strength sit at the centre of healthy ageing.

Strength, muscle and ageing

Stat 15

Adults lose muscle steadily from their thirties onward unless they train against it.

Verified 2 October 2026

Global

3% to 8%

of muscle mass lost per decade after age 30, accelerating after 60

Source: Current Opinion in Clinical Nutrition and Metabolic Care, 2004 →

ComparedMuscle loss is not driven by age alone. It is driven by what is loaded and what is left untrained, which makes it one of the most modifiable markers of ageing.

Stat 16

Sarcopenia, the age-related loss of muscle, is common among older Singaporeans.

Verified 2 October 2026

Singapore

32.2%

of adults aged 60 and above meet sarcopenia criteria; 13.6% across all adults

Source: Journal of the American Medical Directors Association, 2020 →

ComparedClose to one in three Singaporeans over 60 already meets the diagnostic threshold for sarcopenia.

Stat 17

Sarcopenia affects a meaningful share of older adults worldwide.

Verified 2 October 2026

Global

10% to 16%

of older adults globally

Source: Journal of Cachexia, Sarcopenia and Muscle, 2022 →

ComparedSingapore's rate among adults over 60 runs above the global range. Measurement method explains part of the difference, but the signal is real and worth taking seriously.

Stat 18

About one in six community-dwelling older adults in Asia already meets the criteria for sarcopenia.

Verified 2 October 2026

Global

16.5%

of community-dwelling older adults in Asia have sarcopenia by the 2019 Asian Working Group criteria (95% CI 14.7% to 18.4%); the review pooled 140 studies and 156,325 participants, with a minimum age of 60 to 80 across studies

Source: Archives of Gerontology and Geriatrics, 2025 →

ComparedAsian experts have since moved the line earlier. The 2025 consensus of the Asian Working Group for Sarcopenia (Chen LK et al., Nature Aging, November 2025) extends diagnosis to adults aged 50 to 64 with validated thresholds, and simplifies it to low muscle mass together with low strength. Singapore's own Yishun Study, below, found 32.2% at ages 60 and above, though its criteria and sampling differ.

Stat 19

Grip strength predicts mortality more reliably than blood pressure.

Verified 2 October 2026

Global

16% higher

all-cause mortality risk for every 5 kg drop in grip strength

Source: The Lancet, 2015 →

ComparedIn the PURE study across 17 countries, grip strength outperformed systolic blood pressure as a predictor of death.

Stat 20

Older adults who did best on simple balance, strength and stamina tests had far lower mortality.

Verified 2 October 2026

Global

59% lower

all-cause mortality risk in the top fifth versus the bottom fifth of an 8-foot up-and-go test (adjusted hazard ratio 0.41, 95% CI 0.33 to 0.51); 0.55 for the 30-second chair stand and 0.58 for the 2-minute step test. 13,423 Taiwanese adults aged 65 and above, median 7.0 years of follow-up

Source: JAMA Network Open, 2026 →

ComparedAn East Asian cohort, measured with tests that take minutes and minimal equipment. A composite index across the full battery of seven assessments carried the lowest risk of all (0.39), which is the argument for measuring several abilities rather than one. It is an observational study, so it shows an association, not a cause.

Stat 21

Strength training is independently associated with living longer.

Verified 2 October 2026

Global

10% to 17% lower

risk of death and major non-communicable disease with regular muscle-strengthening activity

Source: British Journal of Sports Medicine, 2022 →

ComparedThe benefit holds independently of aerobic exercise. Strength work is not optional for healthspan; it is a separate lever.

Stat 22

The mortality benefit of strength training peaks at about 60 minutes a week, and higher volumes do not add to it.

Verified 2 October 2026

Global

27% lower

all-cause mortality risk at around 60 minutes per week of resistance training; 15% lower at any weekly amount

Source: American Journal of Preventive Medicine, 2022 →

ComparedThe dose-response curve is non-linear: risk falls steeply up to about an hour a week, then flattens, and the benefit diminishes at higher volumes. This is the most useful number on the page for anyone deciding where to start, because it sets the target low enough to be reachable and says plainly that more is not better.

Stat 23

Roughly one in three Singapore residents, and fewer than one in five European adults, does the strength training the evidence keeps pointing at.

Verified 2 October 2026

Singapore

35.7%

of residents aged 18 to 74 did sufficient muscle-strengthening activity in 2024 (at least 2 days a week); 45.2% at ages 18 to 29, then between 31% and 36% in every older age group

Source: Ministry of Health Singapore and Health Promotion Board, 2024

Global

17.3%

of European adults do muscle-strengthening exercise at least twice a week (280,605 adults across 28 countries)

Source: PLoS One, 2020 →

ComparedThe two figures come from different surveys with different age ranges, so read the gap as a direction rather than a precise difference. Singapore's rate has barely moved, from 33.8% in 2020 to 35.7% in 2024, and it drops sharply after the twenties. Set against the 10% to 17% lower mortality risk associated with regular strength work, it is the widest gap on this page between what the evidence supports and what people actually do.

Stat 24

A quarter to nearly two-fifths of the weight lost on GLP-1 medications is fat-free mass, so researchers advise pairing the drugs with nutrition and exercise.

Verified 2 October 2026

Global

25% to 39%

of the total weight lost on GLP-1 receptor agonists over 36 to 72 weeks is a decrease in fat-free mass, a proxy for muscle, according to studies summarised by Prado and colleagues

Source: The Lancet Diabetes and Endocrinology, 2024 →

ComparedThe authors say the loss is largely linked to how much weight is lost rather than to the drugs themselves, a hypothesis still to be tested; calorie restriction without medication, at smaller magnitudes of weight loss, costs 10% to 30% fat-free mass. Long-term effects on frailty and sarcopenia are not yet known, and they recommend using these medications alongside nutrition and exercise.

Stat 25

Extra protein adds only a small amount of lean mass, mainly alongside resistance training, and the evidence is firmer for younger adults than for older ones.

Verified 2 October 2026

Global

0.5 to 0.7 kg

more lean mass in groups given extra protein than in controls, across 66 randomised trials and 2,665 participants (effect size 0.22, moderate certainty)

Source: Journal of Cachexia, Sarcopenia and Muscle, 2022 →

ComparedAlongside resistance training, intakes of 1.2 to 1.59 g/kg a day in adults aged 65 and above were linked with a small gain (effect size 0.20, nine studies, low certainty), and 1.6 g/kg a day or more in younger adults with a larger one (0.30, 23 studies, moderate certainty). Without resistance exercise the lean-mass effect was not statistically significant. Protein supports training, it does not replace it.

Stat 26

High cardiorespiratory fitness is one of the most powerful predictors of a longer life, outperforming most traditional clinical risk factors.

Verified 2 October 2026

Global

~53% lower

all-cause mortality risk in the highest vs lowest cardiorespiratory fitness group, across 20.9 million observations

Source: British Journal of Sports Medicine, 2024 →

ComparedFor every 1-MET increase in fitness, all-cause mortality risk falls by 11 to 17%. Cardiovascular fitness and muscle health are not separate concerns: fitness level is the common dial that moves both.

What inactivity costs, and how the industry is responding.

The cost of inactivity and the fitness industry

Stat 27

Physical inactivity carries a global price tag in the hundreds of billions.

Verified 2 October 2026

Global

US$300 billion

in new treatment costs by 2030, from roughly 500 million preventable disease cases

Source: World Health Organization, 2022

ComparedThat is about US$27 billion every year, spent treating conditions that more movement would have prevented.

Stat 28

The global health-club industry kept growing in 2025, with both revenue and membership up.

Verified 2 October 2026

Global

+6.9% memberships

median net membership growth in 2025 among 244 surveyed operators running nearly 27,000 facilities, with median revenue up 10.7%

Source: Health & Fitness Association, 2026

ComparedThese are medians for the operators that responded, not estimates of the whole market, and revenue is nominal. Demand for structured fitness is rising. The open question is whether it converts into the sustained, progressive training that actually shifts healthspan.

Original data · Catalyst Performance

The Catalyst Healthspan Audit

Over 1500 Singaporeans have now taken the Catalyst Healthspan Audit, our free online self-assessment that scores how well the body is built to last across four pillars: body composition, cardiorespiratory fitness, stability, and strength. The median Healthspan Score is 5.2 out of 10, and just over half of people land in the two lowest bands before they change a thing. This is first-party data from people who took our audit, reported only in aggregate. The figures elsewhere on this page are public research. These are ours.

Who took this

A note on who this is. People who take a healthspan self-assessment are, by definition, a more health-interested slice of Singapore, not a random cross-section of the population. Read the figures below with that in mind: they describe an engaged, motivated group. That is what makes the gaps striking rather than reassuring, because if the people already paying attention look like this, the wider population is unlikely to look any better.

Read by Bervin Manoharan, Co-Founder and General Manager, Catalyst Performance. Updated October 2026.

Singaporeans audited

1500+

Median Healthspan Score

5.2 / 10

In the two lowest bands

~55%

Sarcopenia risk flag

1 in 4

The full report

Download the Singapore Healthspan Report (PDF)

Every finding below, print-ready and free to cite.

01 / 16

Strength training tracks with a higher Healthspan Score, session by session

4.0 → 7.6

Median Healthspan Score (0 to 10) by self-reported weekly strength sessions

4.004.815.626.537.64+

In the Catalyst Healthspan Audit of over 1500 Singaporeans, people who report more weekly strength sessions also score higher, in a consistent step up from 4.0 at zero sessions to 7.6 at four or more.

The pattern is consistent across every frequency band with no plateau. We are careful here: this is an association in a single snapshot of self-reported data, not proof that training caused the higher scores, and part of the relationship is expected by design, since strength training feeds directly into one of the four scored pillars. Read honestly, it still points the same way as the wider resistance-training evidence.

The Catalyst take

We have argued for years that strength is the lever most people under-pull, and our own audience draws the line for us. The people who never lift sit at the bottom, every time.

02 / 16

Even the engaged are not as ready as they think

~55% in the two lowest bands

Share of participants by readiness band

~55%
  • Critical13%
  • At risk42%
  • Developing27%
  • Strong16%
  • Elite2%

in the two lowest bands

Among over 1500 Singaporeans who took our Healthspan Audit, just over half landed in the two lowest readiness bands despite being motivated enough to seek the audit out.

This is the finding that ties the page together, and the self-selection makes it stronger, not weaker. These are not random Singaporeans; they are people engaged enough to measure themselves, and just over half still scored in the bottom two bands. If the health-curious end of the market looks like this, the people who never measure are unlikely to be in better shape.

The Catalyst take

The people taking our audit are already paying attention, and even they are not ready for the decades ahead. That gap between intent and capacity is the whole reason Catalyst exists.

03 / 16

Most people barely strength train, or not at all

Over half do one session a week or none

Share by self-reported weekly strength sessions

0 sessions37%
1 session18%
2 sessions20%
3 sessions15%
4+ sessions10%

In the Catalyst Healthspan Audit, over half of Singaporeans do one weekly strength session or none, with 37 percent doing zero.

Set against the previous finding, this is the heart of the data: the single biggest healthspan lever is the one most people are not using. Self-report most likely flatters the real picture, since people tend to round their training up. The gap is not about motivation, because these people sought out an audit; it is about structure and guidance.

The Catalyst take

The intent is there, the doing is not. Half the people who measured themselves are leaving the highest-return work on the table, and that is a coaching problem, not a willpower one.

04 / 16

Body composition and strength trail cardio and stability

Cardio highest, body composition and strength nearly tied lowest

Average pillar score, as a share of each pillar's maximum

Cardio65%
Stability53%
Strength45%
Body composition44%

Across the Catalyst Healthspan Audit, cardio is the strongest pillar on average while strength and body composition score lowest, essentially tied, the two pillars that decay fastest with age.

The ordering is consistent across the sample and tells a clear story about what Singapore's active population trains and what it neglects. Strength and body composition sit within a point of each other, close enough that we read them as a shared weak point rather than ranking one below the other. Scores are normalised to each pillar's own maximum, so this is about relative neglect, not an absolute physiological ranking.

The Catalyst take

Singapore runs, cycles, and clocks its steps. What it skips is the muscle and composition work that actually protects the back half of life. Our four-pillar lens exists to make that blind spot visible.

05 / 16

The fit-looking but under-muscled paradox

About 18%

~18%

have strong cardio yet weak body composition, a profile a scale and a good run both hide

About 18 percent of Catalyst Healthspan Audit participants, close to one in five, have strong cardio but weak body composition, the classic under-muscled profile.

This is the clearest sign of mis-allocated effort in the data: cardiovascularly fit, but carrying too little muscle relative to their frame. Because the audit scores composition separately from cardio, it surfaces a risk that a bathroom scale and a fast 10k both miss. We flag this as a screening signal, not a diagnosis, and the thresholds are our own.

The Catalyst take

Looking fit and being resilient are not the same thing, and close to one in five of our audit-takers proves it. Cardio earns the appearance; muscle earns the decades.

06 / 16

The Healthspan Score eases down with each decade

5.3 → 5.1

Median Healthspan Score by age band

5.3Under 405.240 to 495.250 to 595.160 and over

In the Catalyst Healthspan Audit, the median Healthspan Score eases from 5.3 in the under-40s to 5.1 in the over-60s, a shallow step down of about a fifth of a point across four decades.

The striking thing is how flat this is. A two-tenths spread across four decades is far gentler than the usual fear narrative, and it is small enough that we treat the ordering as directional rather than a measured decline. Older audit-takers are also a more health-engaged slice of their age group, so the true population curve is almost certainly steeper than this one. Read forward, it says the decade you are in matters far less than what you do in it.

The Catalyst take

The decade-by-decade slide is not destiny; it is a gradient, and the people who train through their 40s and 50s bend it. We coach for the back half of that curve, not the next eight weeks.

07 / 16

The weak point shifts from strength to stability with age

Strength in the 50s, stability at 60+

Strength → stability

the most common weakest pillar peaks as strength in the 50s, then moves to stability after 60

In the Catalyst Healthspan Audit, strength is the most common weakest pillar in the 50s, at 40 percent of that group, while stability overtakes it at 60 and beyond.

The right work is age-dependent: a 55-year-old's biggest gap tends to be force, a 65-year-old's tends to be balance, the pillar most tied to fall risk. The 40s are the honest caveat, because there body composition and strength sit within a few points of each other, with body composition edging ahead, a gap too narrow to call. We read this as a shift in relative weakness, not as strength mattering less with age, and the oldest group is the smallest, so we hold it as a signal rather than a settled fact.

The Catalyst take

There is no single fix for getting older; the gap moves, so the programme has to move with it. Strength first through midlife, stability brought to the front as balance becomes what keeps you independent.

08 / 16

Women and men walk in with different weak points

Women: strength · Men: body composition

Median Healthspan Score and the most common weak point, by sex

Women5.0Men5.4
  • Women. Most common weak point: strength
  • Men. Most common weak point: body composition

In the Catalyst Healthspan Audit, women most often have strength as their weakest pillar while men most often have body composition.

The overall score gap is modest and partly reflects how the composite weights pillars, so we do not lean on 'men are fitter'. The useful finding is the divergence in weakness: women most often need strength work, directly relevant to bone density and the menopausal transition, while men most often need body composition, with stability close behind it and the two near enough that we read them together.

The Catalyst take

The average hides the useful truth: women and men arrive with different gaps, so they should not walk into the same programme. For women in particular, strength is the bone-and-longevity investment the data keeps pointing at.

09 / 16

One in four shows a sarcopenia risk flag before they reach us

1 in 4

Share carrying a screening flag for elevated sarcopenia risk

1 in 4
  • Risk flag25%
  • No flag75%

carry a sarcopenia risk flag

Around one in four Catalyst Healthspan Audit participants carries a screening flag for elevated sarcopenia risk, the age-related loss of muscle.

Muscle-loss risk showing up in a quarter of health-curious adults is a genuine signal, and it ties the dataset together: low strength training, weak body composition, and sarcopenia risk are the same story told three ways. These are screening flags from a self-report instrument, not clinical diagnoses, and the small share who need professional care are routed accordingly.

The Catalyst take

Muscle is the tissue that decides how the next thirty years go, and one in four of our audit-takers is already losing the argument. Catching that early, before it becomes a clinical problem, is the whole point of measuring.

10 / 16

Two in three sit above a healthy weight on Asian cutoffs

~69% on Asian BMI cutoffs

Share by BMI band, Asian cutoffs (overweight at 23, obese at 27.5)

~69%
  • Normal28%
  • Overweight38%
  • Obese31%
  • Underweight3%

above a healthy weight

Using Asian-specific BMI cutoffs, about two in three Catalyst Healthspan Audit participants sit above a healthy weight.

These figures use the lower Asian cutoffs (overweight at 23, obese at 27.5), so they are not comparable to obesity rates quoted on standard cutoffs. BMI is a blunt screening proxy that cannot separate muscle from fat, which is exactly why we pair it with the body-composition pillar; read together, the high overweight share and the low body-composition scores point the same way.

The Catalyst take

BMI on its own is crude, but two-thirds above the healthy line, sitting next to body composition as the weakest pillar, is a pattern we trust. The fix is not just less weight; it is more muscle under that weight.

11 / 16

People come to live longer, not to look better

Longevity is the top reason

Top stated reason for taking the audit

Live longer45%
Look better22%
Feel better22%
Rebuild from injury7%
Keep up with kids4%

The top reason people take the Catalyst Healthspan Audit is to live longer, well ahead of looking better.

Longevity, not aesthetics, is the dominant driver among people seeking out a healthspan audit, which fits a healthspan-first positioning over a transformation-first one. There is selection at play, since an audit framed around healthspan attracts longevity-minded people, so this describes our audience, not all of Singapore.

The Catalyst take

People are no longer just chasing a look; they want the years, and the quality of those years. That is the conversation we have been built around from day one.

12 / 16

A real quantified-self segment, and it peaks in the 40s

~34% enter exact numbers

~34%

entered exact measurements rather than estimates, a proxy for owning a smart scale, wearable, or lab data; this peaks in the 40 to 49 band

About a third of Catalyst Healthspan Audit participants enter exact figures rather than estimates, a proxy for tracking themselves with a smart scale, wearable, or lab data, and that share peaks in the 40s.

This marks a distinct, addressable persona: data-literate, mid-life, and ready to act on numbers. It is an inference from how people answered rather than a verified device-ownership survey, so we treat it as a strong proxy, not a measured fact. It also tells us this audience respects evidence, which is how we communicate anyway.

The Catalyst take

A large share of the people we attract already live by their own numbers, and they peak right at the age when the data starts to matter most. They do not want hype; they want a programme that reads the numbers as seriously as they do.

13 / 16

Cardio is the most comforting and most misleading number

The weak point for only ~7%

~7%

of participants have cardio as their weakest pillar, by far the rarest weak point

Cardio is the highest-scoring pillar in the Catalyst Healthspan Audit and the weakest pillar for only about one in fourteen people, by far the rarest weak point.

The market is over-invested in the pillar it already does well and under-invested in the two that decay fastest. We are not knocking cardio, which is genuinely protective; the point is allocation. The risk is that a strong cardio number gives people false reassurance about a picture the audit shows is weaker elsewhere.

The Catalyst take

A strong cardio score is the most comforting and most misleading number people bring us, because it is rarely where the real gap is. Feeling fit on a run is not the same as being built for the decades.

14 / 16

Demand for measuring healthspan doubled, then held at the new level

More than doubled, then flat

2x, then held

monthly completed audits more than doubled from May to June 2026, then held steady through July

Completed Catalyst Healthspan Audits more than doubled from May to June 2026, then held roughly flat into July.

The honest read is a step change rather than a climb: interest jumped to a new level and stayed there, instead of compounding month on month. Three months is still a short run, and some of the June jump reflects marketing reach rather than pure organic pull, so we do not extrapolate a trend line from it. What holding the level does show is that the June figure was not a one-month spike. We track this monthly and update it as more complete months land.

The Catalyst take

Interest in measuring healthspan is not a trickle, and it did not fall back after the jump. Singapore is asking the healthspan question at a materially higher rate than it was in May, and we are the ones holding the instrument.

15 / 16

Healthspan thinking is starting before 40

The under-40s are the largest group

Share of participants by age band

  • Under 4037%
  • 40 to 4923%
  • 50 to 5925%
  • 60 and over15%

largest group is under 40

The largest single age group taking the Catalyst Healthspan Audit is under 40, and they post the highest scores.

A healthspan-framed instrument pulling its largest audience from under-40s says longevity thinking is moving earlier in life, which supports a forward-framed '30s and beyond' positioning that starts before decline sets in. As a self-selected online audience this skews younger and more digital than a walk-in market, so we read it as where the interest is, not the full picture of who needs the work.

The Catalyst take

Healthspan is no longer a conversation people put off until 60; the biggest slice of our audit-takers is under 40 and starting early. That is exactly the timing that works, because the cheapest decade to protect is the one before it slips.

16 / 16

Cardio is almost never the pillar holding someone back

Weakest for 8% of participants

Share of participants by which pillar scored lowest for them

Strength31%
Body composition31%
Stability30%
Cardiorespiratory8%

Among over 1500 Singaporeans who took the Catalyst Healthspan Audit, cardiorespiratory fitness was the lowest-scoring of the four pillars for only 8 percent of them. Strength, body composition and stability accounted for the rest, splitting it almost evenly at roughly 31, 31 and 30 percent.

This is the individual view of the pillar ranking above, and the two agree: cardio scores highest on average, so it is rarely anyone's personal weak point. The reading is not that cardio does not matter, it is that in a population which already runs and cycles, the binding constraint sits somewhere else. Read it as an association in a single snapshot of self-reported answers, and note that a near three-way split means the weak point is genuinely individual rather than predictable from demographics.

The Catalyst take

Most people arrive believing their fitness problem is their engine. For nine in ten of them the audit disagrees, and points at strength, body composition or stability instead. That is the case for measuring all four rather than training the one that feels hardest.

How we read this data

These figures come from over 1500 people, the large majority based in Singapore, who completed our free online Healthspan Audit. They are self-selected and health-engaged, not a representative sample of all Singapore, and most answers are self-reported, so we read everything as directional rather than diagnostic. The Healthspan Score is our own composite, useful for comparison within the audit but not a clinical measure, and the bands are readiness labels, not medical diagnoses. BMI uses Asian-specific cutoffs, which sit lower than standard ones. Where we note that one group scores differently, that is an association in a single snapshot, not proof of cause, and smaller subgroups carry more uncertainty.

These figures are free to cite with attribution and a link back. Suggested citation: Catalyst Performance. "The Catalyst Healthspan Audit: First-Party Healthspan Data, Singapore." Aggregate data from over 1500 free Healthspan Audit participants. Last updated October 2026. https://catalystperformance.sg/fitness-and-longevity-statistics#catalyst-audit

Catalyst View

Our reading of the numbers

Bervin Manoharan

Co-Founder and General Manager, Catalyst Performance

Every source on this page was re-checked this month. One figure moved. Singapore's Population Trends 2026 shows 19.5 percent of residents are now aged 65 or older, up from 12.4 percent ten years ago. That is nearly one in five, and a gain of 7.1 percentage points in a decade.

A second number changed, because we corrected the way we measure it. We had set a Department of Statistics life expectancy against a healthy life expectancy from a different method, and the Ministry of Health says those two are not comparable. On one method, the Global Burden of Disease 2023 figures it publishes, men in Singapore spend about 10 years of life in less than full health and women about 12. The global gap is 10.7 years, up from 8.8 in 1990. A larger share of people is entering the decade where good health ends, and nothing about the way most of us train has changed to meet it.

The tools that protect that decade are not mysterious. The mortality benefit of strength training peaks at around 60 minutes a week, where all-cause mortality risk sits 27 percent lower. Only 17.3 percent of European adults strength train at least twice a week. By 60, 32.2 percent of Singaporeans meet the criteria for sarcopenia.

I read this month's data as a deadline that is moving closer, not a threat. The dose is small, and the people who need it most are arriving at the age where it counts. Start in your 30s and 40s, because the decade you build muscle in is not the decade you need it.

Nearly one in five Singapore residents is now 65 or older. An hour a week of strength training is the cheapest protection we know of.

How this page works

Primary sources, dated, free to cite

Every figure here comes from a primary source: peer-reviewed research, the World Health Organization, the Singapore Department of Statistics and Ministry of Health, the Institute for Health Metrics and Evaluation, and recognised industry bodies. Secondary aggregators and unsourced numbers are not used.

The page is reviewed and refreshed every month, and each statistic carries the date its sources were last verified. You are free to cite any figure. We ask only that you link back to this page and name the primary source, which sits beside every number.

Our own work, meaning the Healthspan Audit data, the comparisons and calculations, the charts and the commentary, is licensed under Creative Commons Attribution 4.0 (CC BY 4.0). Reuse it with credit and a link back. The figures from other publishers stay with them, so cite those at source.

Cite this page

Catalyst Performance. "Healthspan and Fitness Statistics: Singapore and the World." Last updated 2 October 2026. https://catalystperformance.sg/fitness-and-longevity-statistics

Common questions

Frequently asked questions

Q. 01

How current are these statistics?

This page is reviewed and refreshed every month. Each statistic carries the date its sources were last verified, and every figure links to a named primary source so you can check it directly.

Q. 02

Can I cite or republish these statistics?

Yes. Cite any figure on this page, and name the primary source that sits beside it. Our own work, meaning the Healthspan Audit data, the comparisons and calculations, the charts and the commentary, is licensed under Creative Commons Attribution 4.0 (CC BY 4.0). Reuse it with credit and a link back. The figures from other publishers stay with them, so cite those at source.

Q. 03

Why does Singapore's physical activity figure look so high?

Singapore's National Population Health Survey counts total physical activity, which includes commuting and work. In 2024 commuting alone made up 51.6% of that total and leisure-time exercise just 24.7%. The headline 84.7% is real, but the share that comes from deliberate training is much smaller.

Q. 04

What is the difference between lifespan and healthspan?

Lifespan is how long a person lives. Healthspan is how long they live in good health, free of significant disease or disability. On the Global Burden of Disease measure published by the Ministry of Health, men in Singapore spend about 10 years of life in less than full health and women about 12.

Q. 05

Where do the numbers come from?

Every figure on this page comes from a primary source: peer-reviewed journals, the World Health Organization, the Singapore Department of Statistics, the Ministry of Health, the Institute for Health Metrics and Evaluation, and recognised industry bodies. Secondary aggregators and unsourced figures are not used.

Embed

Use these charts on your own site

Every chart below is free to publish on any site, with no sign-up and no usage limit. Copy the snippet, paste it into your page, and keep the credit line that comes with it. The figures are the same ones in the table above, each traceable to a named primary source.

Looking for interactive tools instead? Our calculators embed the same way.

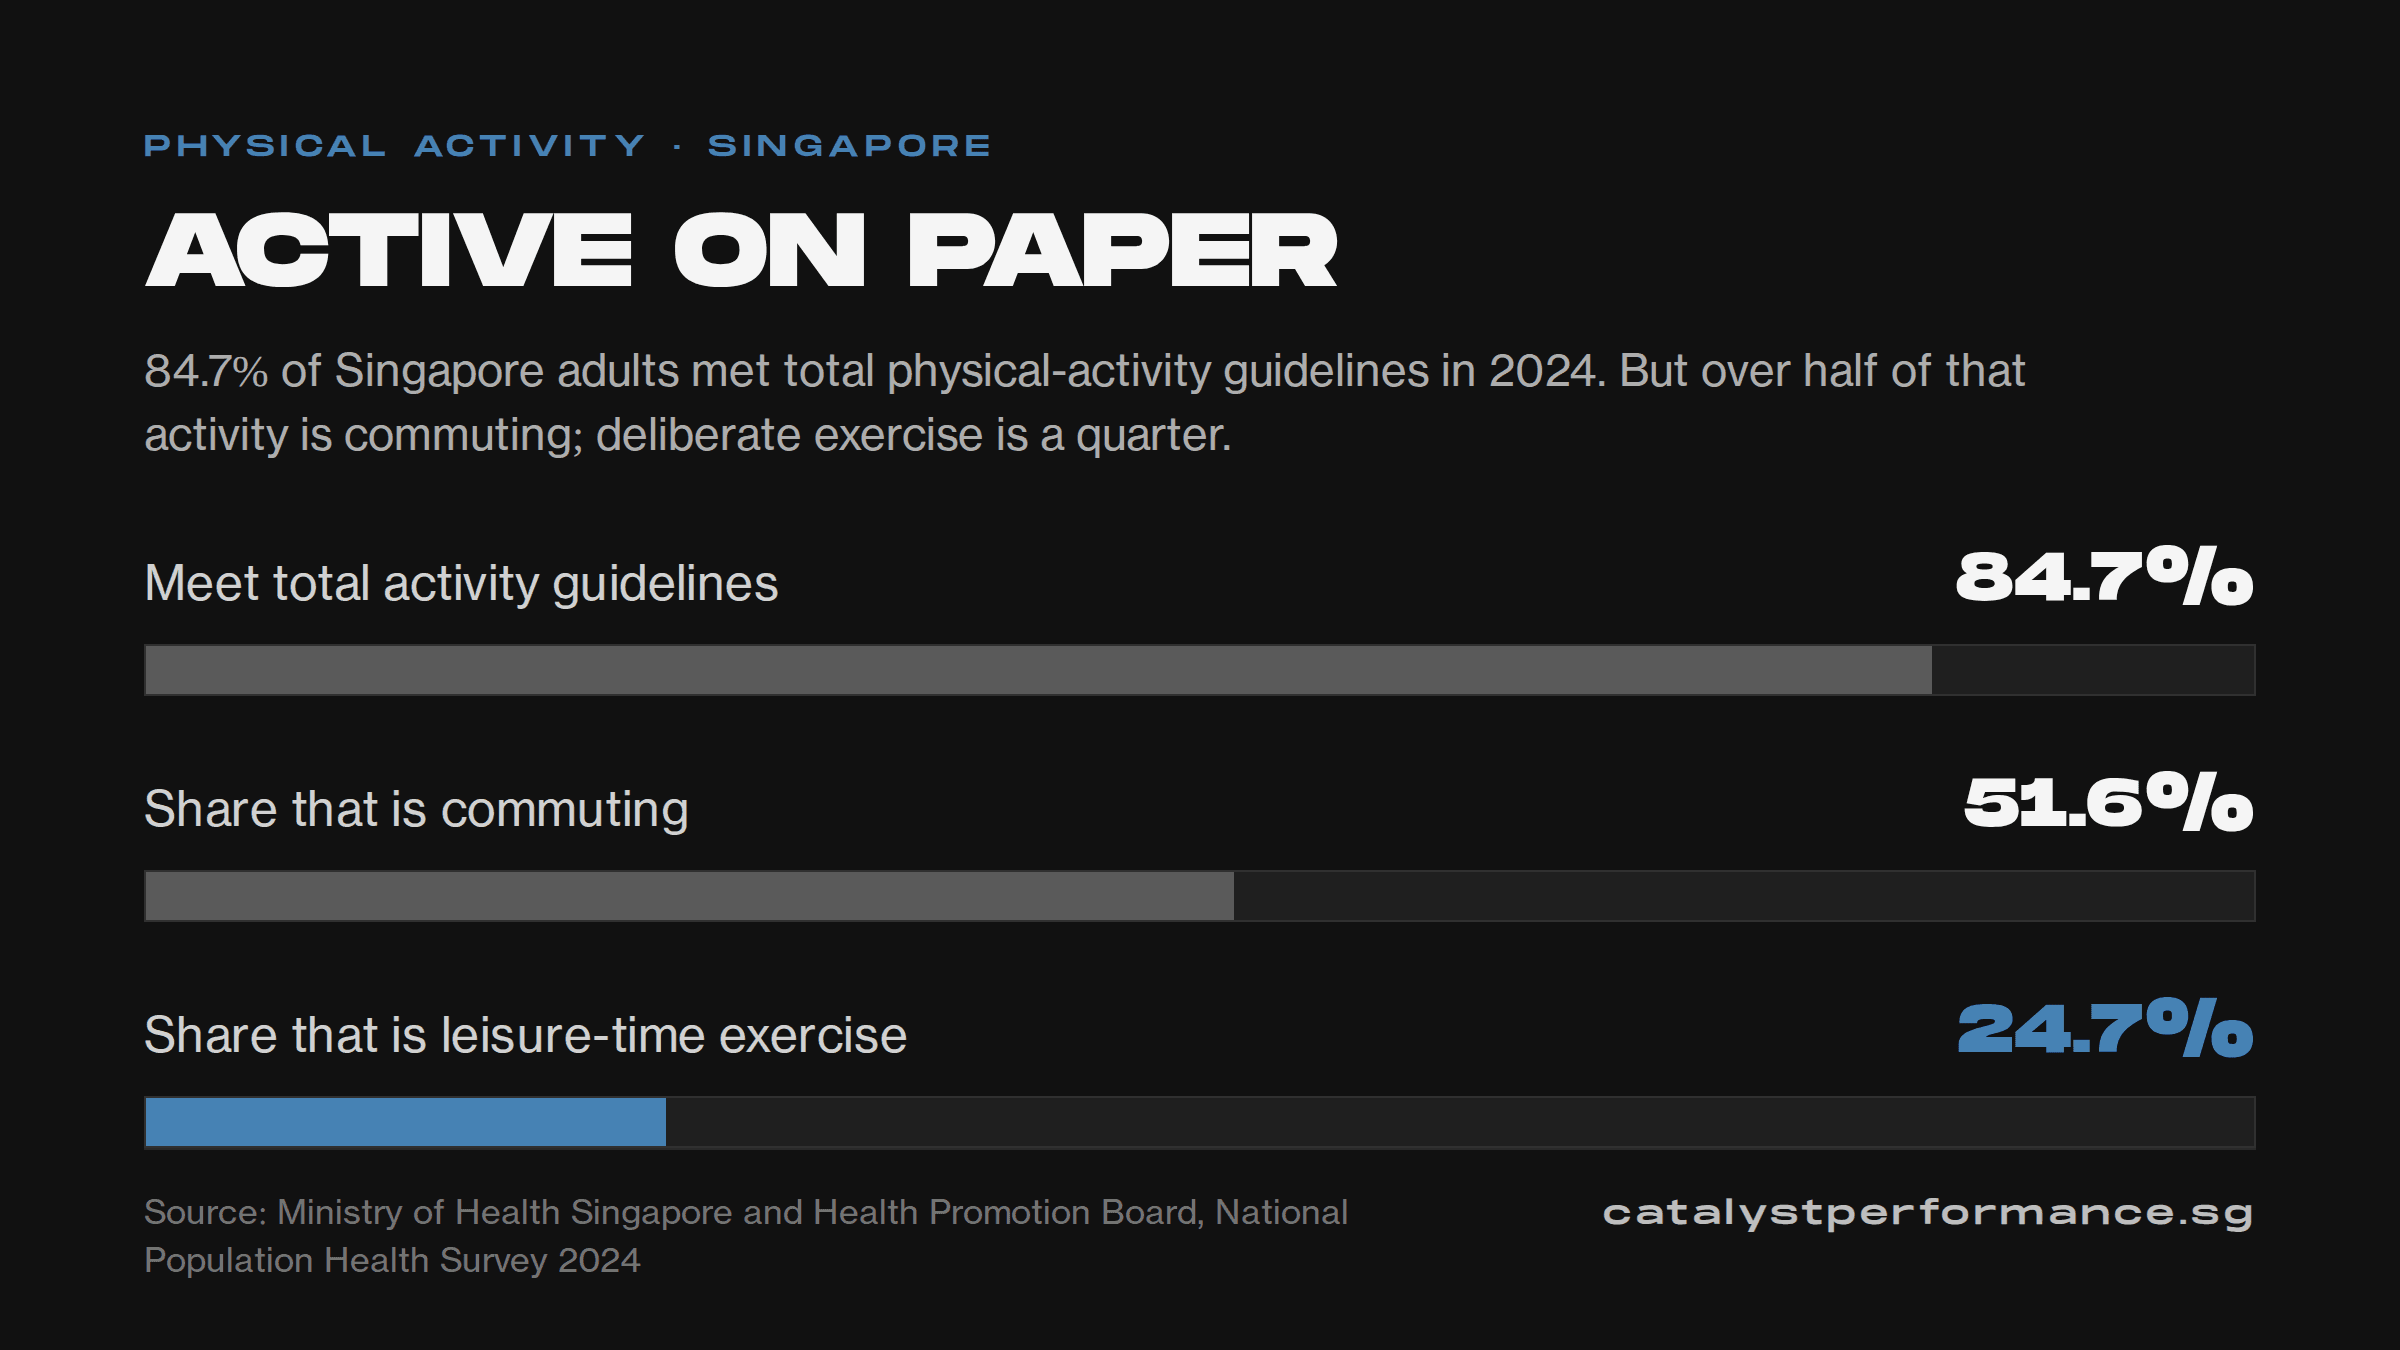
Active on paper

Most Singapore adults meet the total activity guidelines, but over half of that activity is commuting and only a quarter is deliberate exercise.

Chart: 84.7% of Singapore adults meet total physical-activity guidelines, 51.6% of that activity is commuting and 24.7% is leisure-time exercise.
<img src="https://catalystperformance.sg/statistics-charts/singapore-activity.png" alt="Chart: 84.7% of Singapore adults meet total physical-activity guidelines, 51.6% of that activity is commuting and 24.7% is leisure-time exercise." width="1200" height="675" style="max-width:100%;height:auto" loading="lazy">
<p style="font-size:13px;line-height:1.5;text-align:center;margin:8px 0">Chart: <a href="https://catalystperformance.sg/fitness-and-longevity-statistics">Singapore physical activity statistics</a> by <a href="https://catalystperformance.sg">Catalyst Performance</a>, a healthspan and longevity focused personal training studio in Singapore.</p>

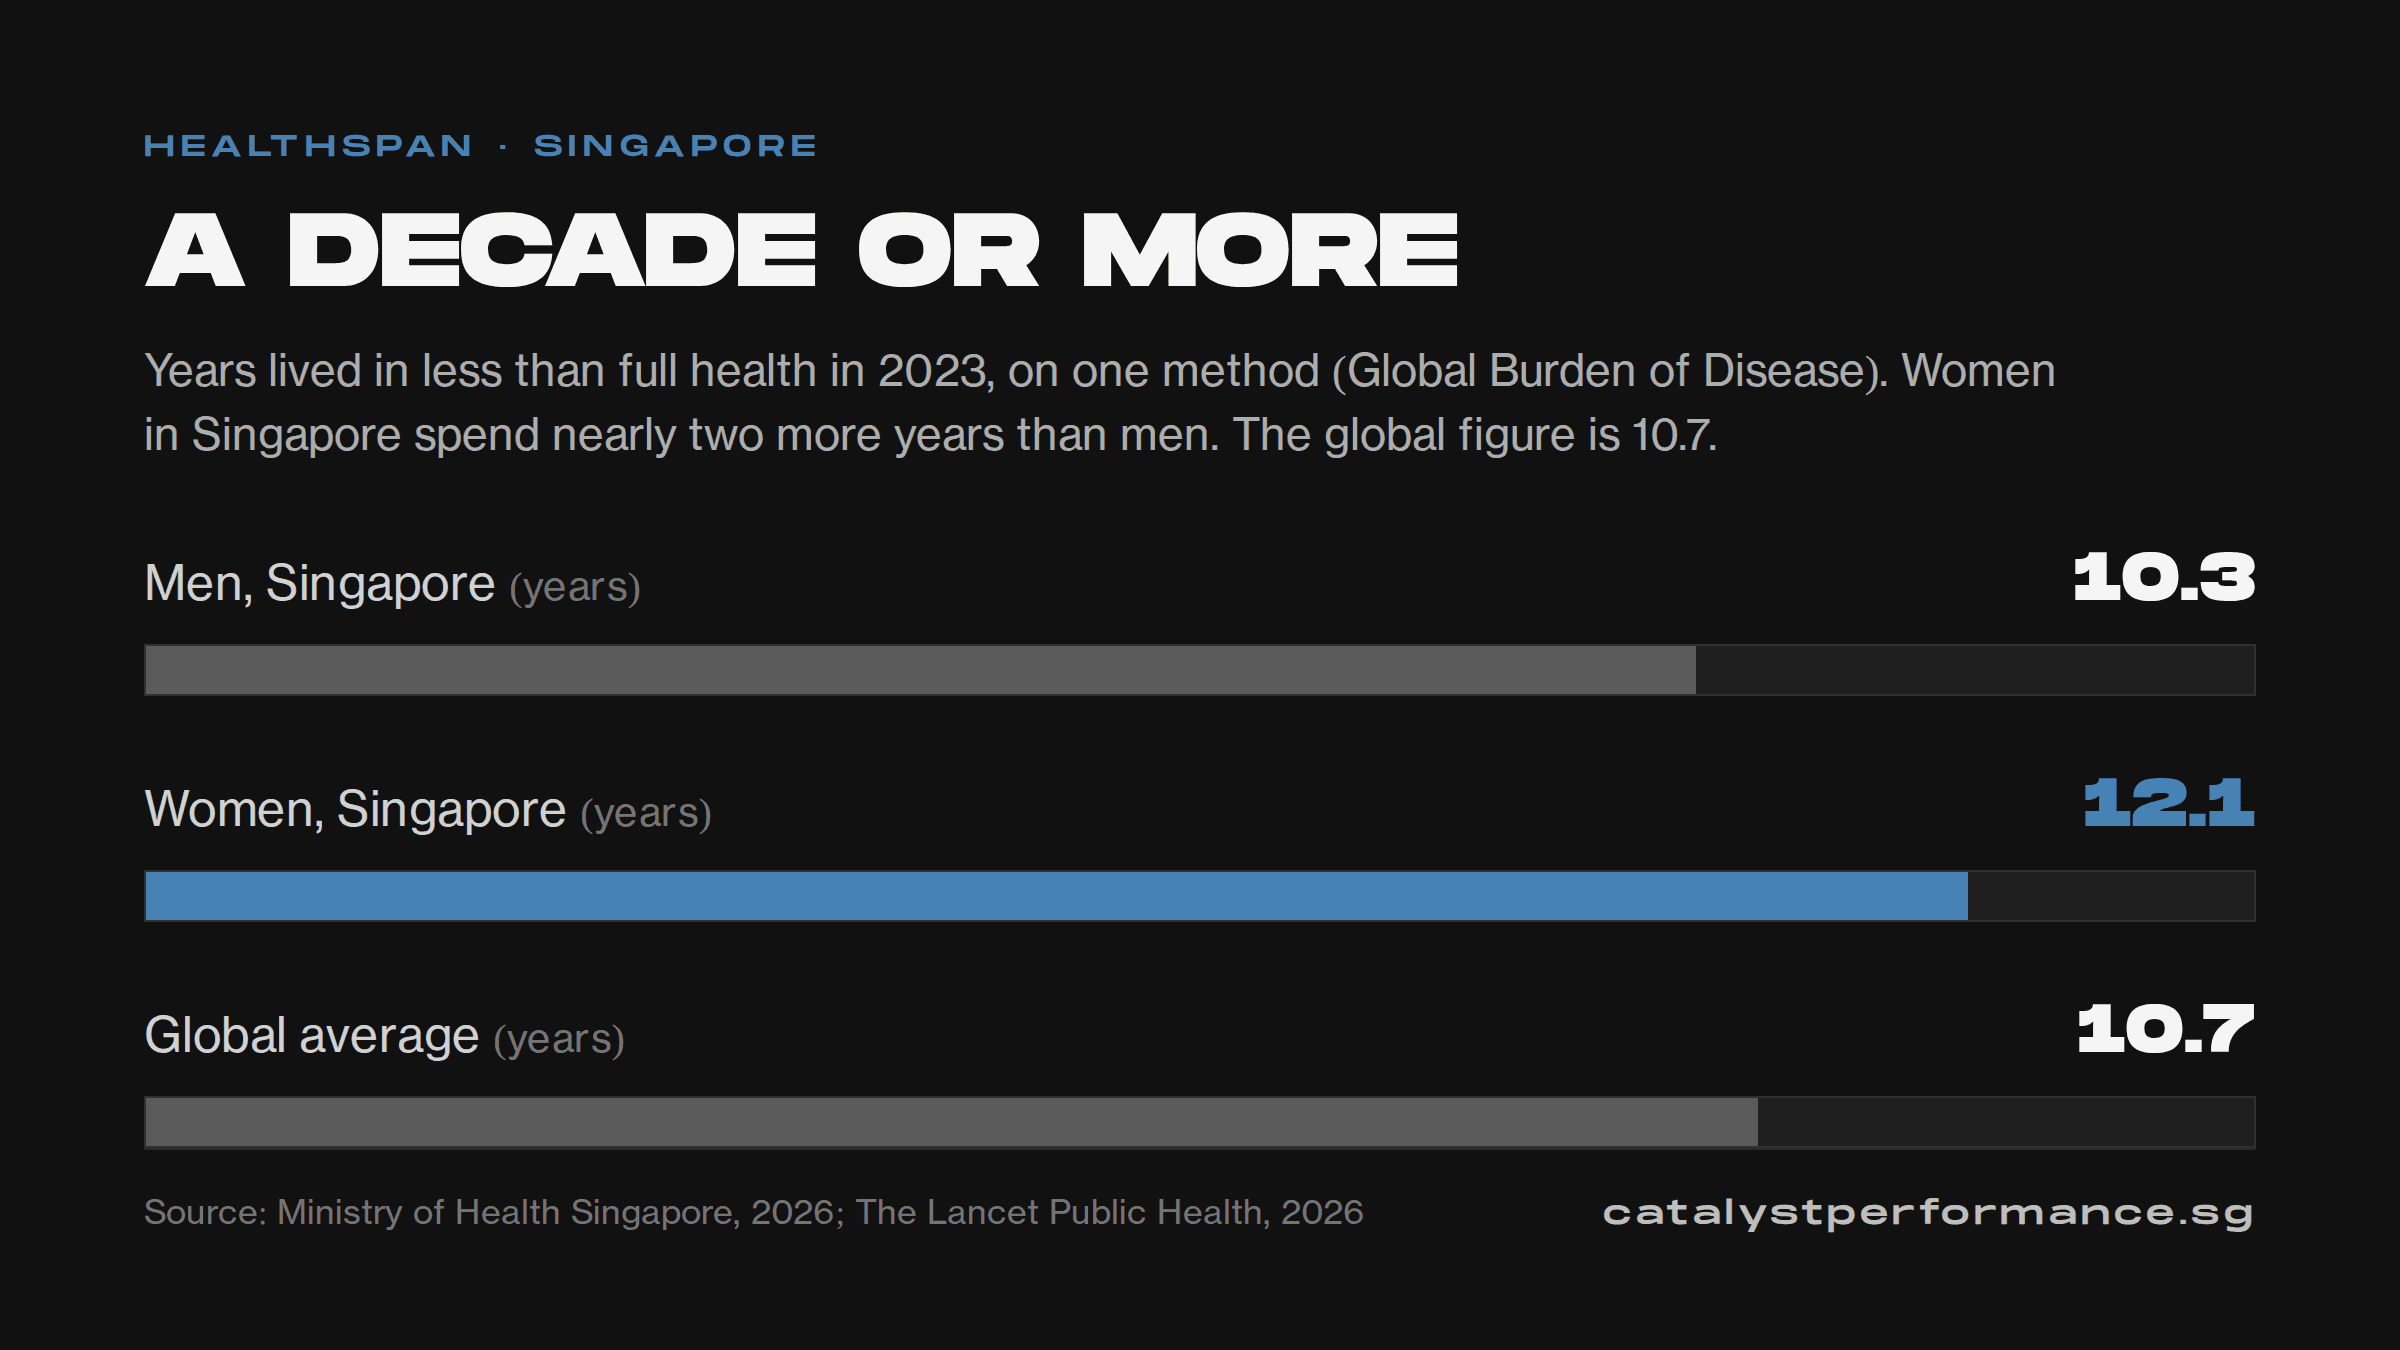
A decade or more

Years lived in less than full health in Singapore, men and women, against the global average, on one method.

Chart: people in Singapore spend 10.3 years (men) and 12.1 years (women) of life in less than full health, against a global average of 10.7 years.
<img src="https://catalystperformance.sg/statistics-charts/healthspan-gap-singapore.png" alt="Chart: people in Singapore spend 10.3 years (men) and 12.1 years (women) of life in less than full health, against a global average of 10.7 years." width="1200" height="675" style="max-width:100%;height:auto" loading="lazy">
<p style="font-size:13px;line-height:1.5;text-align:center;margin:8px 0">Chart: <a href="https://catalystperformance.sg/fitness-and-longevity-statistics">Singapore healthspan gap statistics</a> by <a href="https://catalystperformance.sg">Catalyst Performance</a>, a healthspan and longevity focused personal training studio in Singapore.</p>

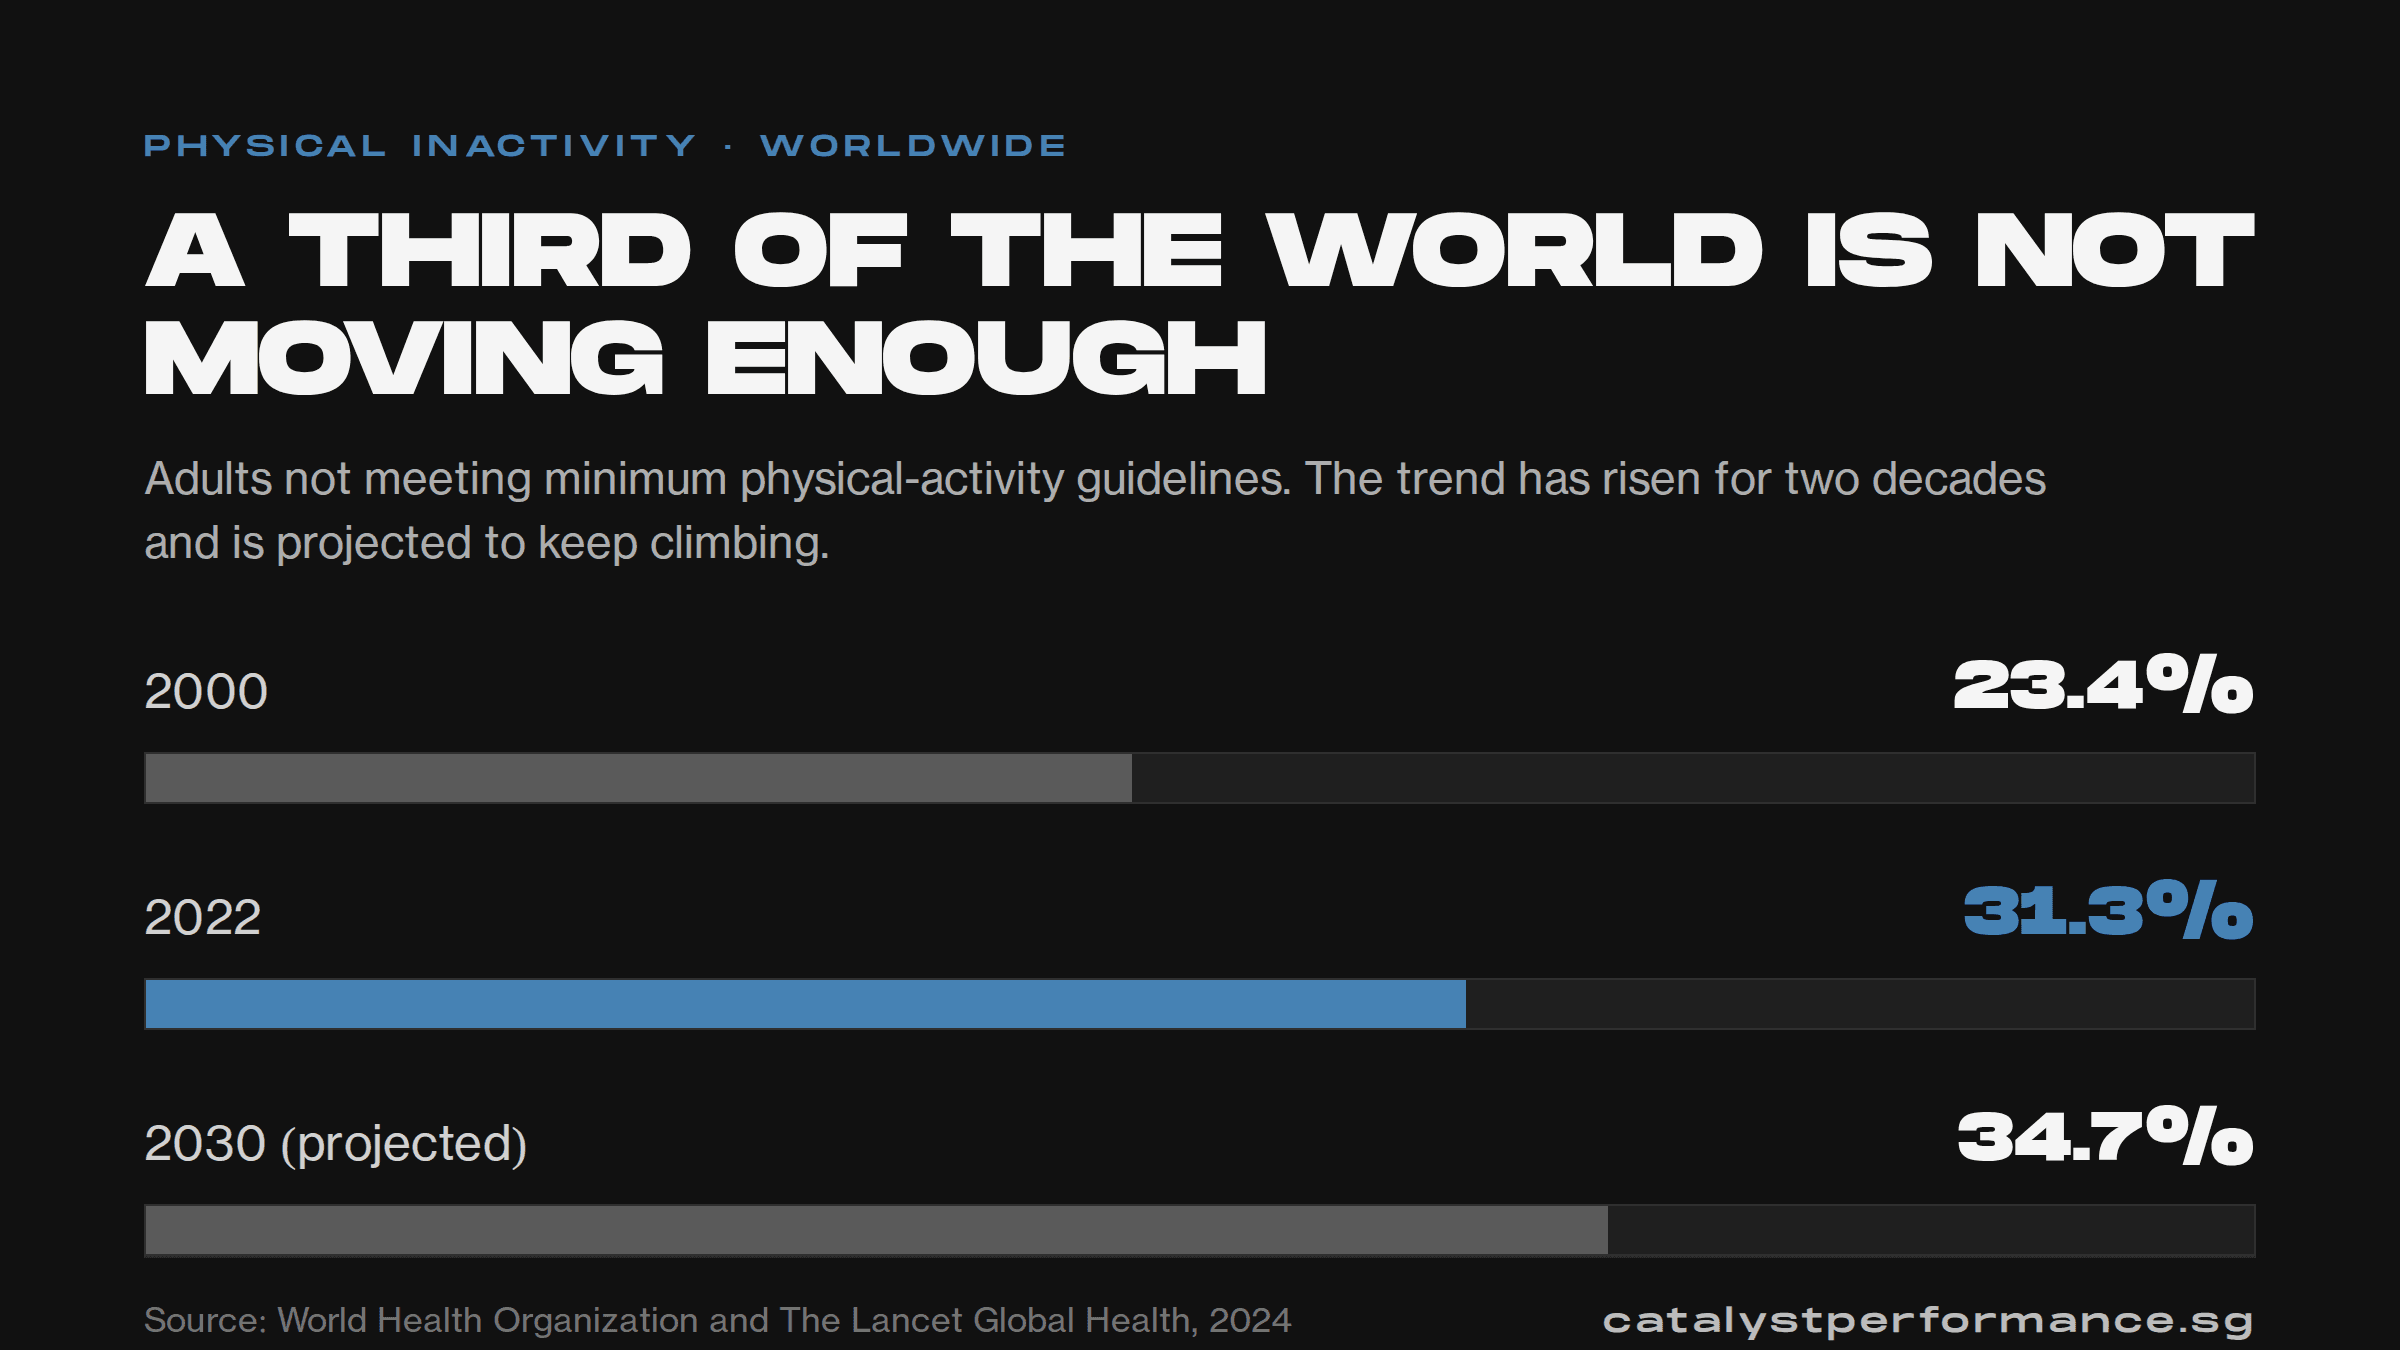
A third of the world is not moving enough

Adults worldwide not meeting minimum physical-activity guidelines, from 2000 to the 2030 projection.

Chart: adults not meeting physical-activity guidelines worldwide rose from 23.4% in 2000 to 31.3% in 2022, projected to 34.7% by 2030.
<img src="https://catalystperformance.sg/statistics-charts/global-inactivity.png" alt="Chart: adults not meeting physical-activity guidelines worldwide rose from 23.4% in 2000 to 31.3% in 2022, projected to 34.7% by 2030." width="1200" height="675" style="max-width:100%;height:auto" loading="lazy">
<p style="font-size:13px;line-height:1.5;text-align:center;margin:8px 0">Chart: <a href="https://catalystperformance.sg/fitness-and-longevity-statistics">global physical inactivity statistics</a> by <a href="https://catalystperformance.sg">Catalyst Performance</a>, a healthspan and longevity focused personal training studio in Singapore.</p>

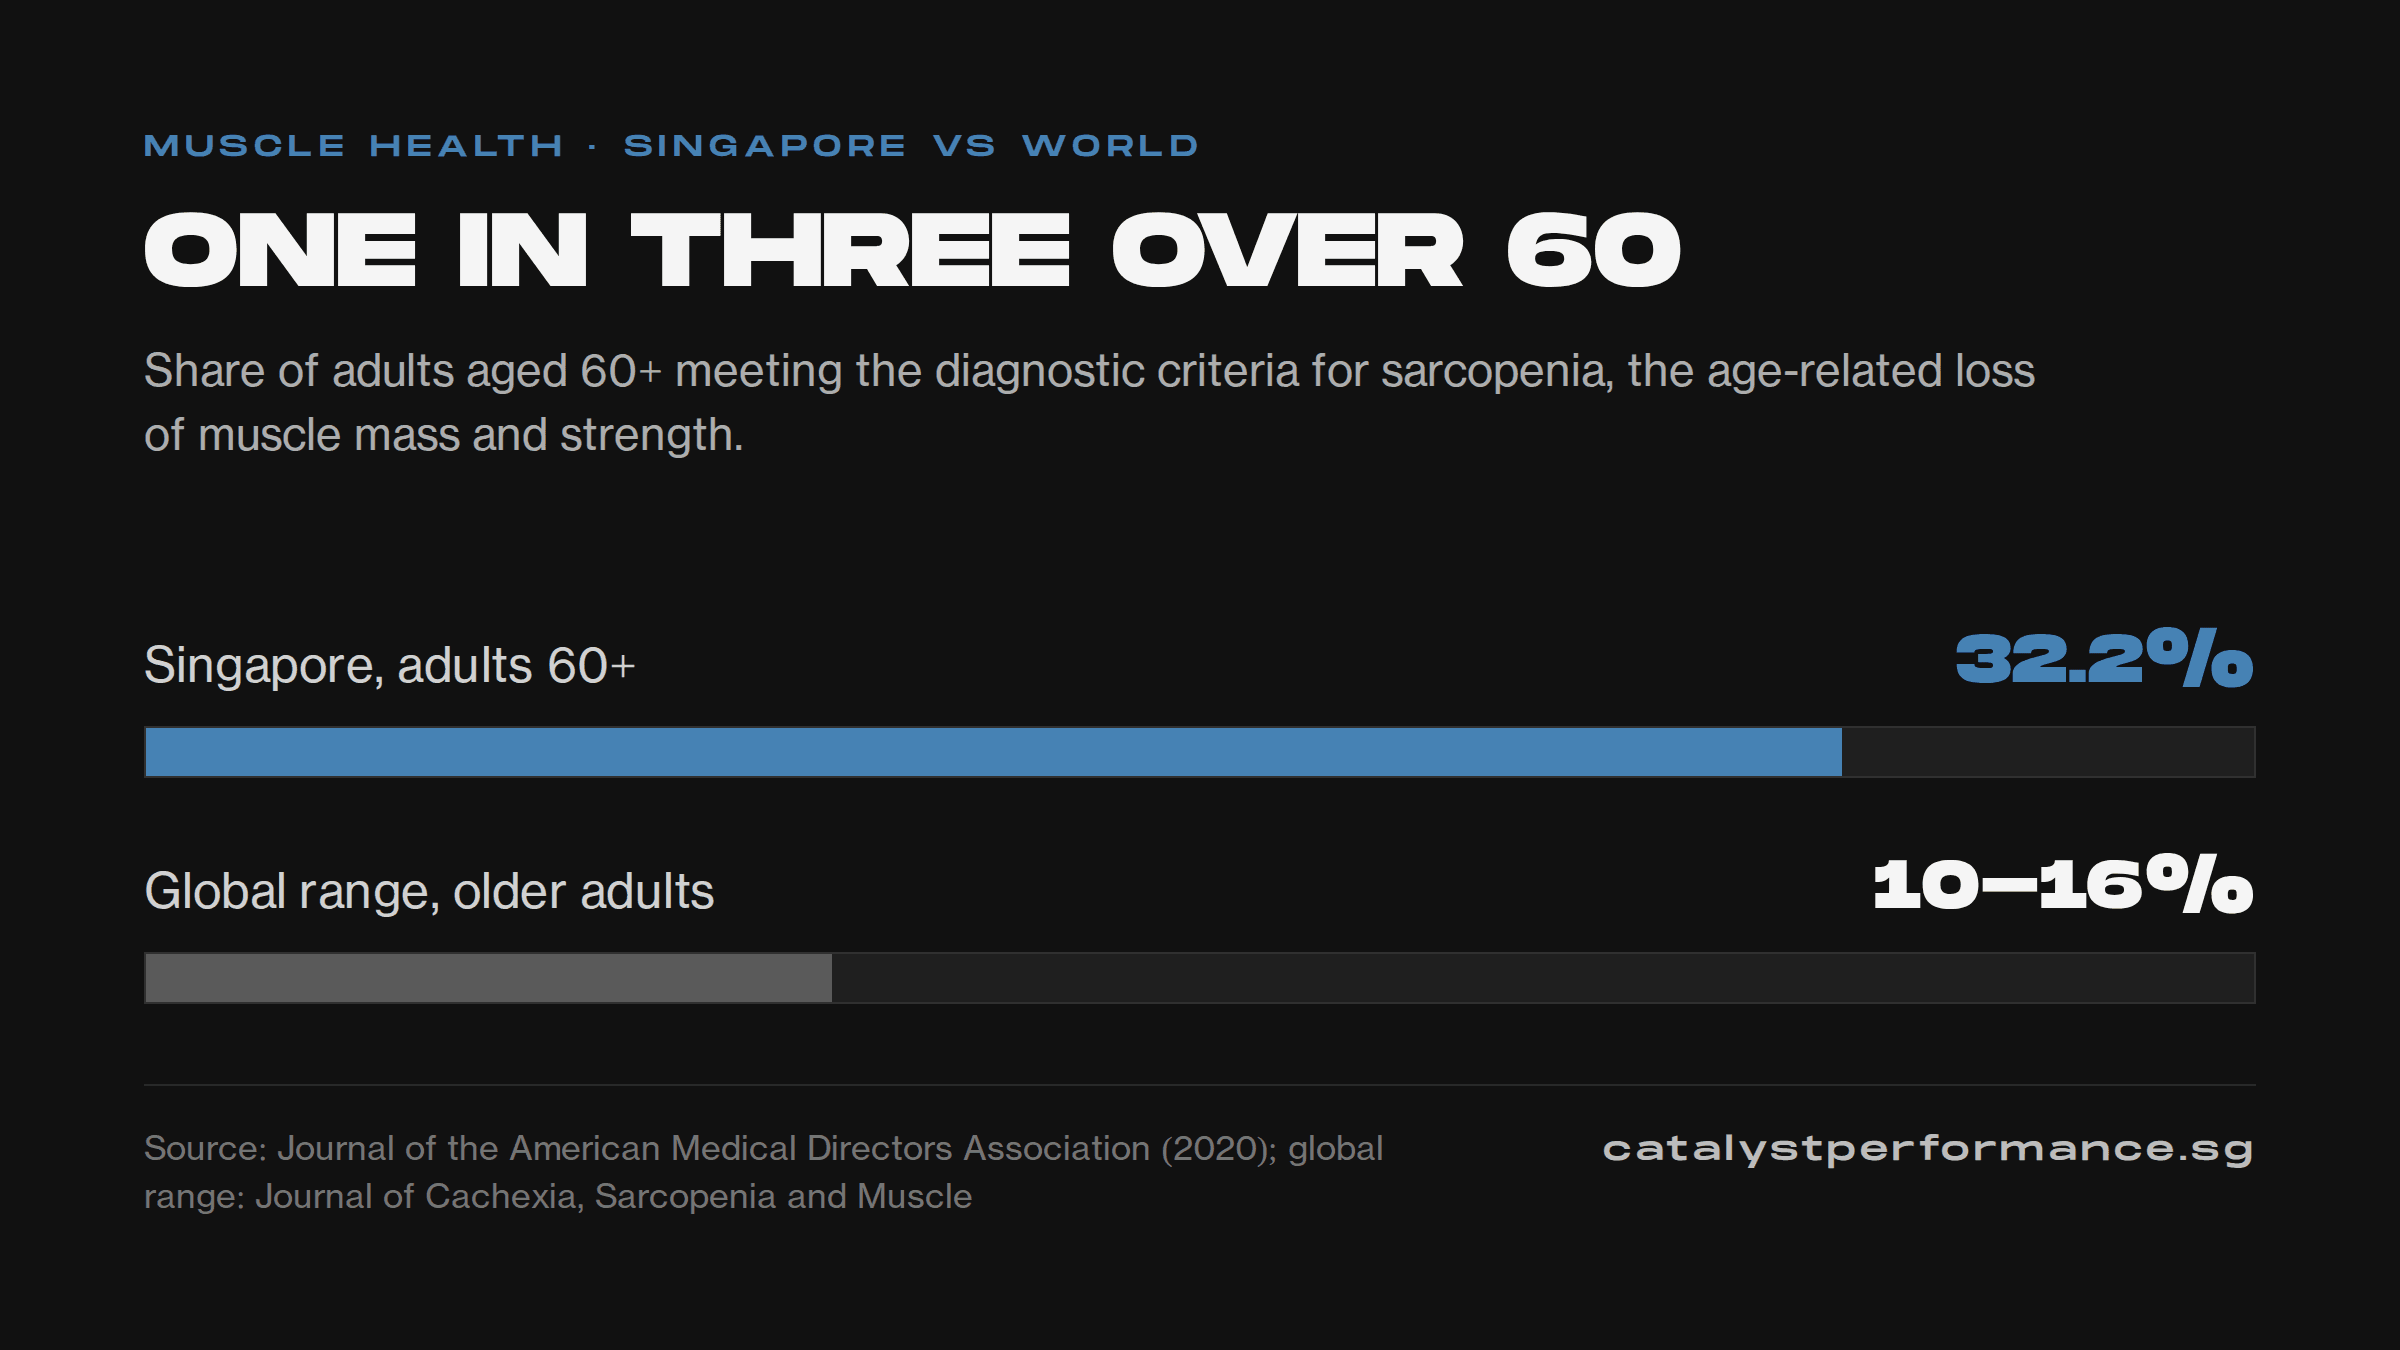
One in three over 60

Sarcopenia prevalence among Singapore adults aged 60 and over, against the global range for older adults.

Chart: 32.2% of Singapore adults aged 60 and over meet the diagnostic criteria for sarcopenia, against a global range of 10% to 16%.
<img src="https://catalystperformance.sg/statistics-charts/sarcopenia-singapore.png" alt="Chart: 32.2% of Singapore adults aged 60 and over meet the diagnostic criteria for sarcopenia, against a global range of 10% to 16%." width="1200" height="675" style="max-width:100%;height:auto" loading="lazy">
<p style="font-size:13px;line-height:1.5;text-align:center;margin:8px 0">Chart: <a href="https://catalystperformance.sg/fitness-and-longevity-statistics">Singapore sarcopenia statistics</a> by <a href="https://catalystperformance.sg">Catalyst Performance</a>, a healthspan and longevity focused personal training studio in Singapore.</p>

Sources

Every figure traces to a named primary source

  1. 01

    World Health Organization and The Lancet Global Health. National, regional, and global trends in insufficient physical activity among adults from 2000 to 2022.

    Strain T, et al. The Lancet Global Health, 2024;12(8):e1232-e1243. https://www.thelancet.com/journals/langlo/article/PIIS2214-109X(24)00150-5/fulltext

  2. 02

    Ministry of Health Singapore and Health Promotion Board. National Population Health Survey 2024.

    Government of Singapore, 2024. https://www.moh.gov.sg/newsroom/national-population-health-survey-2024-shows-singaporeans-are-adopting-healthier-lifestyles---but-rising-obesity-is-a-concern/

  3. 03

    Sport Singapore. National Sport and Exercise Participation Survey.

    Sport Singapore, published via the Singapore Department of Statistics (2024 data). https://data.gov.sg/datasets/d_2d565f0c1a8edf09446939f61495a2e4/view

  4. 04

    The Lancet Public Health. Daily steps and all-cause mortality: a meta-analysis of 15 international cohorts.

    Paluch AE, et al. Lancet Public Health, 2022;7(3):e219-e228 (47,471 adults, 15 cohorts). https://pmc.ncbi.nlm.nih.gov/articles/PMC9289978/

  5. 05

    Department of Statistics Singapore. Complete Life Tables for Singapore Resident Population 2024-2025.

    Government of Singapore, June 2026 (data years 2024-2025). https://www.singstat.gov.sg/news/complete-life-tables-for-singapore-resident-population-2024-2025

  6. 06

    World Health Organization. World Health Statistics 2024.

    World Health Organization, 2024 (life-expectancy data year 2021; unchanged in the 2025 and 2026 editions, which republish the same Global Health Estimates). https://www.who.int/news/item/24-05-2024-covid-19-eliminated-a-decade-of-progress-in-global-level-of-life-expectancy

  7. 07

    Department of Statistics Singapore. Population Trends 2026.

    Government of Singapore, 2026 (twenty-second edition; reports the 65-and-over share for residents, where the 2025 edition reported citizens). https://www.singstat.gov.sg/publication-resources/population-trends-2026

  8. 08

    Ministry of Health Singapore. Population and Vital Statistics.

    Ministry of Health Singapore, accessed 2 October 2026; Global Burden of Disease 2023 estimates of life expectancy and health-adjusted life expectancy at birth for the total population, residents and foreigners. MOH notes these are not directly comparable with the Department of Statistics resident life expectancy. https://www.moh.gov.sg/others/resources-and-statistics/population-and-vital-statistics/

  9. 09

    The Lancet Public Health. Global, regional, and national trends in the morbidity gap and contributing diseases, injuries, and risk factors, 1990-2023: a systematic analysis for the Global Burden of Disease Study 2023.

    Hay SI, Nam P, Saqib H, et al. The Lancet Public Health, 2026;11(8):e487-e505. https://doi.org/10.1016/S2468-2667(26)00098-8

  10. 10

    Blue Zones, Dan Buettner. Singapore: an engineered Blue Zone 2.0.

    Designation by Dan Buettner, reported by CNBC, 2024. https://www.cnbc.com/2024/03/27/singapore-has-engineered-a-society-that-lives-to-100-heres-how.html

  11. 11

    Current Opinion in Clinical Nutrition and Metabolic Care. Muscle tissue changes with aging.

    Volpi E, Nazemi R, Fujita S. 2004;7(4):405-410. https://pmc.ncbi.nlm.nih.gov/articles/PMC2804956/

  12. 12

    Journal of the American Medical Directors Association. Prevalence and Associated Factors of Sarcopenia in Singaporean Adults (The Yishun Study).

    Tay L, et al. JAMDA, 2020;21(10):1530.e1-1530.e8. https://www.jamda.com/article/S1525-8610(20)30436-9/fulltext

  13. 13

    Journal of Cachexia, Sarcopenia and Muscle. Global prevalence of sarcopenia and severe sarcopenia: a systematic review and meta-analysis.

    Petermann-Rocha F, et al. 2022;13(1):86-99. https://onlinelibrary.wiley.com/doi/10.1002/jcsm.12783

  14. 14

    Archives of Gerontology and Geriatrics. The Evolving Landscape of Sarcopenia in Asia: A Systematic review and meta-analysis following the 2019 Asian working group for sarcopenia (AWGS) diagnostic criteria.

    Weng SE, Huang YW, Tseng YC, Peng HR, Lai HY, Akishita M, Arai H, Hsiao FY, Chen LK. Archives of Gerontology and Geriatrics, 2025;128:105596 (published online 31 July 2024). https://doi.org/10.1016/j.archger.2024.105596

  15. 15

    The Lancet. Prognostic value of grip strength: findings from the Prospective Urban Rural Epidemiology (PURE) study.

    Leong DP, et al. The Lancet, 2015;386(9990):266-273. https://www.thelancet.com/journals/lancet/article/PIIS0140-6736(14)62000-6/abstract

  16. 16

    JAMA Network Open. Physical Fitness and All-Cause Mortality in Older Adults.

    Wu M, Hsu C, Hsu H, et al. JAMA Network Open, 10 August 2026; nationwide cohort of 13,423 Taiwanese adults aged 65 and above, median follow-up 7.0 years. https://jamanetwork.com/journals/jamanetworkopen/fullarticle/10.1001/jamanetworkopen.2026.28227

  17. 17

    British Journal of Sports Medicine. Muscle-strengthening activities are associated with lower risk and mortality in major non-communicable diseases.

    Momma H, et al. Br J Sports Med, 2022;56(13):755-763. https://pmc.ncbi.nlm.nih.gov/articles/PMC9209691/

  18. 18

    American Journal of Preventive Medicine. Resistance Training and Mortality Risk: A Systematic Review and Meta-Analysis.

    Shailendra P, Baldock KL, Li LSK, Bennie JA, Boyle T. Am J Prev Med, 2022;63(2):277-285. https://doi.org/10.1016/j.amepre.2022.03.020

  19. 19

    PLoS One. The epidemiology of muscle-strengthening exercise in Europe: A 28-country comparison including 280,605 adults.

    Bennie JA, De Cocker K, Smith JJ, Wiesner GH. PLoS One, 2020;15(11):e0242220. https://pmc.ncbi.nlm.nih.gov/articles/PMC7688125/

  20. 20

    The Lancet Diabetes and Endocrinology. Muscle matters: the effects of medically induced weight loss on skeletal muscle.

    Prado CM, Phillips SM, Gonzalez MC, Heymsfield SB. The Lancet Diabetes & Endocrinology, 2024;12(11):785-787 (Comment). https://doi.org/10.1016/S2213-8587(24)00272-9

  21. 21

    Journal of Cachexia, Sarcopenia and Muscle. Systematic review and meta-analysis of protein intake to support muscle mass and function in healthy adults.

    Nunes EA, Colenso-Semple L, McKellar SR, et al. Journal of Cachexia, Sarcopenia and Muscle, 2022;13(2):795-810. https://pmc.ncbi.nlm.nih.gov/articles/PMC8978023/

  22. 22

    British Journal of Sports Medicine. Cardiorespiratory fitness is a strong and consistent predictor of morbidity and mortality among adults: an overview of meta-analyses representing over 20.9 million observations from 199 unique cohort studies.

    Lang JJ, Prince SA, Merucci K, et al. Br J Sports Med, 2024;58(10):556-566. https://pmc.ncbi.nlm.nih.gov/articles/PMC11103301/

  23. 23

    World Health Organization. Global Status Report on Physical Activity 2022.

    World Health Organization, 2022. https://www.who.int/news/item/19-10-2022-who-highlights-high-cost-of-physical-inactivity-in-first-ever-global-report

  24. 24

    Health & Fitness Association. 2026 HFA Global Report.

    Health & Fitness Association, 14 September 2026 (survey of 244 operators running nearly 27,000 facilities, calendar year 2025; benchmarks for the operators that responded, not an estimate of the total global market). https://www.healthandfitness.org/2026-hfa-global-report/

From the population to you

These are population numbers, get your own

The free Catalyst Healthspan Audit estimates your own Healthspan Score across four pillars in about two minutes. 12 questions, no studio visit, no contact details until the end.

Take the free Healthspan Audit →